
If you are looking to take your data visualization skills to the next level, you have come to the right place. So, welcome to the guide on Tableau aggregate functions.
Tableau is a powerful tool that allows you to analyze, visualize, and share data. However, to unlock its full potential, you need to understand the concept of aggregate functions.
In this guide, I will walk you through Tableau aggregate functions, and explore the common types, and their use cases in analysis.
Let’s dive in!
Understanding the Role of Aggregate Functions
Generally, aggregate functions play vital roles in data analysis, allowing you to perform different calculations to generate meaningful insights. In Tableau, aggregate functions are used to manipulate data and help to make informed decisions.
By applying aggregate functions, you can calculate totals, averages, counts, and other statistical measures that provide a concise representation of your data.
Also, aggregate functions allow you to compress data, when working with large datasets, allowing you to gain insights from large datasets quickly. This enables you to gain a deeper understanding of your data and communicate your insights effectively.
Hence, by choosing the right aggregation functions, you can accurately present your data and communicate meaningful insights.
Creating a Tableau Aggregation Calculation — An Example
Let’s quickly explore how to create an aggregation calculation in Tableau with this example.
Sample Dataset: Download here.
Example: Find the sum of sales of each segment (Consumer, Corporate, and Home Office).
Steps to create
1. To start with, launch Tableau. Select a data source, and choose your data (Sample Superstore)
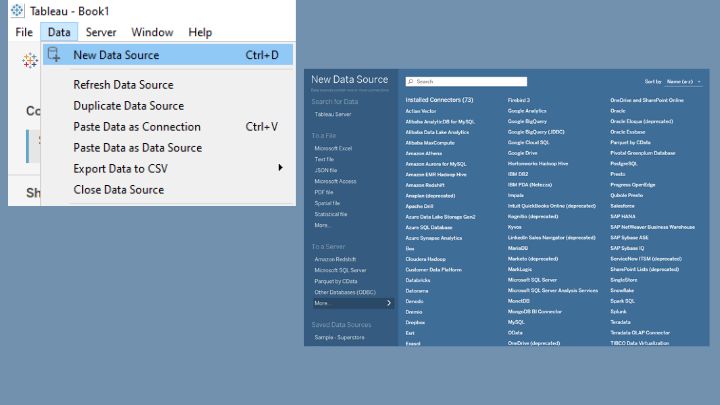
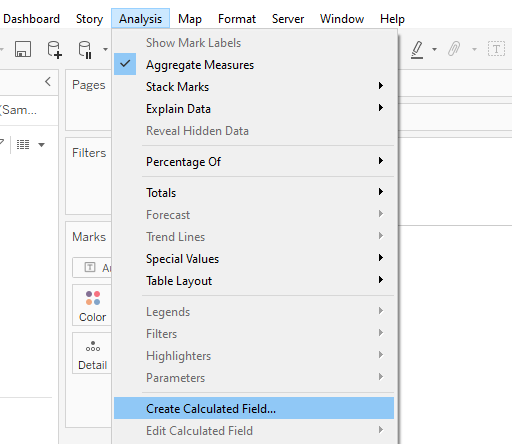
2. After loading the data, go to the “Analysis” menu and select “Create Calculated Field” to create a new calculated field.
3. This will display a new window – a calculated field editor. You can choose to name it, e.g. “Sum of Sales.” Then write the formula to calculate the sum of sales.
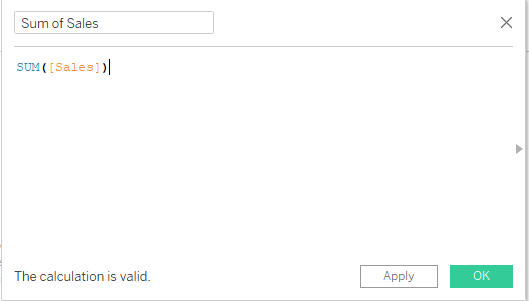
4. After writing the formula, click “OK” to create the calculated field “Sum of Sales.” Once you create the calculated field, it will reflect in the Data Pane titled “Sum of Sales.” Now, use it in your visualization.
Common Aggregation Functions in Tableau
Tableau offers several aggregation functions which serve different analytic purposes. Let’s go through some of them and their use cases:
1. AVG
- AVG returns the average of all the selected numeric values
- AVG ignores the NULL values in the calculation
Example:
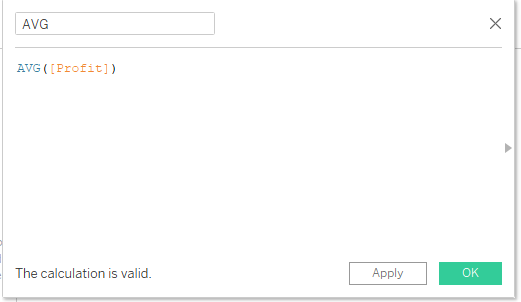
The above formula calculates the average profit of the data.
2. CORR
- It calculates the correlation between two expressions.
- It measures the linear relationship between the variables
Syntax: CORR(expression1, expression)
Example:
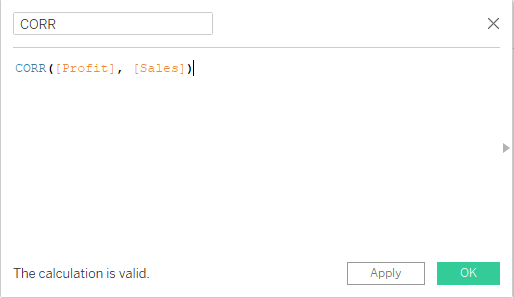
The above formula will return the correlation between Profit and Sales.
3. VAR/VARP
- VAR calculates the variance of all selected values based on a sample of the population
- VARP is similar but calculates the entire population.
Example:
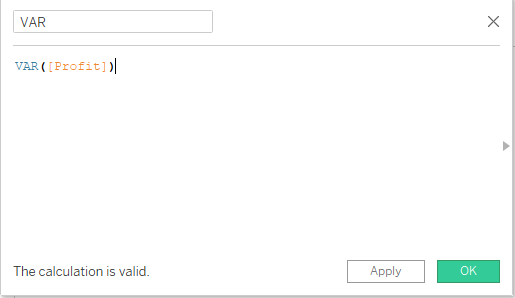
This formula will calculate and return the variance of the Profit data.
4. COVAR/COVARP
- COVAR (covariance), calculates the sample between two expressions and measures their relationship
- COVARP is similar but considers the entire population.
Example:
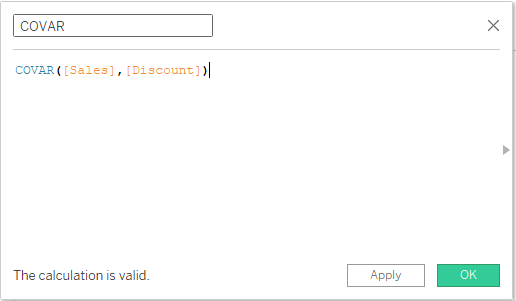
The above formula will return the covariance between Sales and Discount
5. STDEV/STDEVP
- STDEV (standard deviation) calculates the standard deviation of a sample population
- STDEVP calculates the entire population
Example:
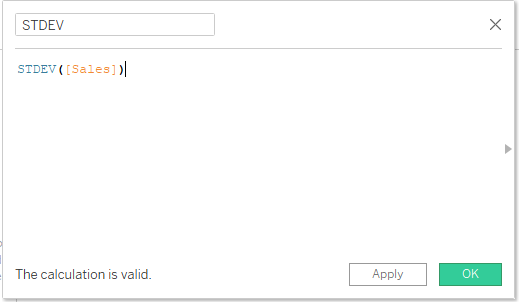
The above formula will return the standard deviation of the sample Sales data.
6. COUNT
- The COUNT function returns the number of items in a group or the selected expression.
- It does not count NULL values
Example:
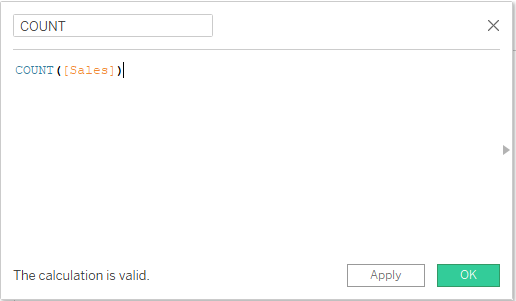
This formula will return the number of entries in the “Sales” field.
7. COUNTD
- This COUNTD formula returns the number of distinct items in a group or the selected expression
- This formula does not count NULL values
Example:
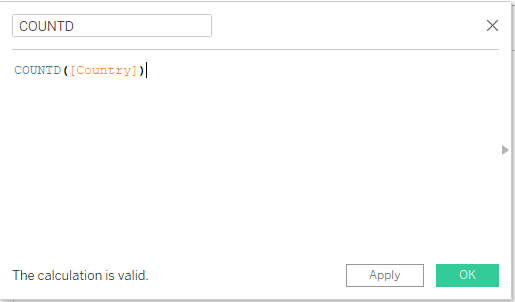
This formula will return the number of distinct countries in the “Profit “Country” field.
MAX/MIN
- MAX returns the maximum value of the expression
- MIN returns the minimum value.
- For string values, MAX returns the last value based on alphabetical order, while MIN returns the first value.
Example:
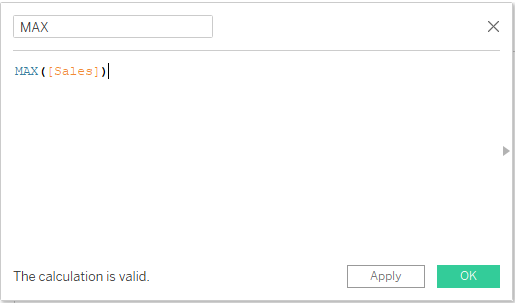
This formula will return the maximum value of the “Sales” field.
9. MEDIAN
- MEDIAN returns the median of the selected numeric values in the expression
- It ignores NULL values in the calculation.
Example:
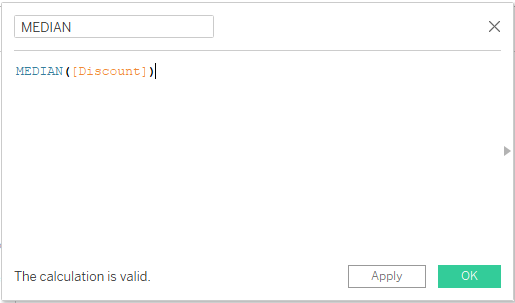
This formula will return the median value of the “Discount” field.
Benefits of Using Tableau Aggregate Functions
Using aggregates offers several benefits that enhance the efficiency and effectiveness of data analysis and visualization. The following are some benefits of using aggregation functions:
Faster Computation
Aggregates help reduce the computational workload when working with large datasets. Pre-calculating aggregations allow for quicker rendering and responsiveness of visualizations, improving overall performance.
Focus on Key Insights
Also, aggregates help highlight key data insights such as trends, patterns, and outliers. This enables data professionals to focus on key data insights.
Enhance Visualization Performance
Visualization tools are optimized to work with aggregates, leading to faster rendering and interaction with the data. Utilizing aggregates aligns with the strengths of these tools, ensuring a seamless user experience.
Effective Data Comparison
Aggregates facilitate easy comparison of data across different dimensions. Visualizations with aggregated values allow for quick comparisons between categories, time periods, or geographical regions.
Simplify the Data
Also, aggregates break down large datasets into summaries. By calculating totals, averages, or other aggregate functions, complex datasets are simplified, making it easier to understand and interpret the data.
How to Avoid Errors When Working With Tableau Aggregate Functions
When using aggregation functions in Tableau, there are common mistakes you should avoid so as not to affect your analysis and visualizations. Some of these errors include:
Over-Aggregation
Over-aggregating data often leads to data ambiguity. So, when using aggregation functions, be conscious of how you apply these functions as unnecessary aggregation can obscure important data trends and patterns.
Incorrect Aggregation Functions
Always make sure you use the correct aggregation functions as wrong aggregation functions can lead to incorrect results. For example, using the SUM function for non-numeric fields can produce misleading outcomes.
Ignoring NULL Values
Failing to handle NULL values appropriately can negatively impact your data accuracy. While some aggregation functions ignore NULL values, others include them. So, ensure you handle NULL values based on the context of your analysis.
Using Aggregates and Raw Data in the Same Visualization
Combining both raw data and aggregates in a single visualization can lead to confusion. So, always keep both aggregated and non-aggregated data separate for clarity and to avoid misinterpretation.
Aggregating Already Aggregated Data
Applying aggregation functions to already aggregated data may lead to wrong calculations. So, always verify your data to avoid redundant aggregation processes.
Not Validating Results
Don’t forget to always cross-check your calculations to ensure their accuracy.
Conclusion: Harnessing the Power of Tableau Aggregate Functions
Congratulations! You have just learned about aggregation functions in Tableau and how to use them!
Equipped with this knowledge, understanding your data, selecting appropriate aggregation functions, and using the right aggregation techniques, etc., you can create engaging and interactive visualizations to better convey your data insights.
Thanks for reading!