Over the years, Power BI has evolved and become an effective tool for data analysis and visualization. However, while most users are familiar with just the basics, there are other advanced data modeling techniques in Power BI that can improve your data model.
For every analysis, data modeling is essential, as it involves creating relational and logical expressions of data, which can be used to build reports, dashboards, and a range of analytical tools.
In this article, we will explore some advanced data modeling techniques in Power BI that can help you create more robust and sophisticated data models for your projects.
So, let’s go!
Understanding Basic and Advanced Data Modeling in Power BI
To analyze and visualize data in Power BI, you must have a solid understanding of how data modeling works. Basically, data modeling involves data organization for easy analysis by creating table relationships, defining data structures, and so on.
However, while basic Power BI data modeling is great, there are several advanced modeling techniques that can take your analysis to the next level. With them, you can handle complex data structures, create hierarchies, and perform other advanced calculations.
Through these advanced modeling techniques, you can improve the accuracy and efficiency of your data analysis, allowing you to drive meaningful insights and make data-driven decisions.
Introduction: Advanced Data Modeling Techniques in Power BI
The following are some advanced data modeling Techniques in Power BI and how to use them during analysis.
1. Hierarchical Data Structures
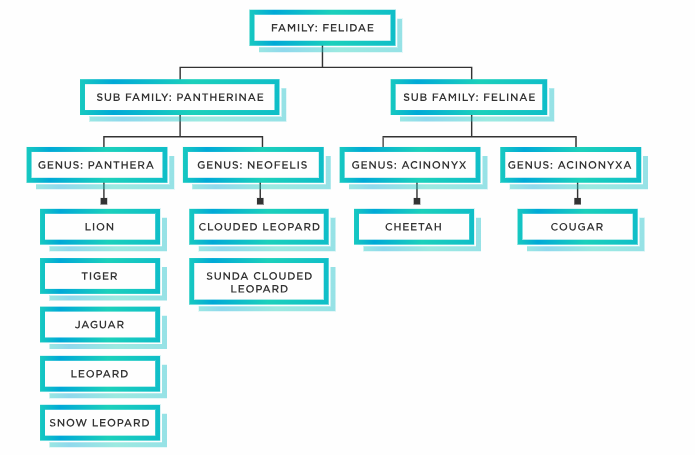
Hierarchical data structures represent relationships between data in a tree-like fashion. In Power BI, this technique is used to organize data that has a parent-child relationship, such as organizational charts, product categories, or geographical hierarchies.
Hierarchical data structures allow you to navigate and analyze data in a way that mirrors real-world relationships.
Techniques for Modeling Hierarchical Data in Power BI
If you have a table that contains “product sales” data. You can create a hierarchical structure based on the product category, subcategory, and product name. This will allow you to drill down and analyze data from each category.
Also, you can use other hierarchical techniques like self-referencing tables – creating a two-table relationship to show parent-child relationships, and bridge tables – connecting multiple tables in a hierarchical structure.
These hierarchical techniques help you navigate and analyze complex hierarchical data more intuitively.
2. Advanced DAX Calculations
DAX (Data Analysis Expressions) formula is another advanced modeling technique used in Power BI for complex data. With DAX, you can perform a plethora of functions such as calculating date differences, percentage change, and so on.
Also, through Data Analysis Expressions (DAX), you can implement complex calculated columns and measures. While calculated columns are based on other table column values, measures are generated on the fly depending on the context of your analysis.
For example, if you want to calculate the percentage of sales for every product category in your data model. You can calculate the percentage using a DAX calculation dividing the sales for each category by the total sales and multiplying the result by 100.
3. Advanced Relationships in Data Modeling
Relationships are like the glue that holds your data together in Power BI, defining how tables in your data model are connected, allowing you to slice and dice your data across different dimensions.
Hence, understanding relationships is essential for creating meaningful visualizations and gaining valuable insights from your data.
Advanced Relationship Types for Enhanced Data Modeling
In Power BI, advanced relationships such as many-to-many, bi-directional relationships, and cross-filtering can enhance your data model. Through these advanced relationship types, you can manage complex data scenarios and create dynamic reports.
For instance, if your data model has two tables – sales data and customer information. You may link these two tables using a common field, such as the customer ID, allowing you to analyze sales data by customer demographics, location, etc.
4. Advanced Time Intelligence Functions and Modeling Techniques
Time intelligence functions in Power BI enable you to perform calculations and analyze data based on specific time periods.
Whether you want to compare year-over-year performance, calculate rolling averages, or identify trends, understanding time intelligence is essential for any data professional.
Applying Advanced Time Intelligence Functions
Power BI offers several advanced time intelligence functions such as DATESBETWEEN, TOTALYTD, SAMEPERIODLASTYEAR, etc., allowing you to solve more complex time-based calculations and gain deeper data insights.
To fully leverage the potential of time intelligence in Power BI, you must create custom date tables, which offer more flexibility and precision for time-based analysis, such as defining custom fiscal calendars, handling irregular intervals, etc.
5. Advanced Data Modeling for Predictive Analytics
Basically, predictive analytics involves using historical data and statistical procedures to forecast or make predictions about future trends or events.
With Power BI offering various built-in predictive analytics features, such as forecasting and clustering, you can easily uncover trends and patterns, identify outliers, and make data-driven predictions.
However, to maximize the accuracy and effectiveness of your predictive analytics models, you should employ advanced data modeling techniques such as feature engineering, and data preprocessing to model selection and evaluation, etc.
6. Parameters as an Advanced Data Modeling Technique in Power BI
Parameters are a powerful and versatile tool in Power BI that can significantly enhance your data modeling and analysis capabilities by adding interactivity and flexibility to your reports.
Instead of hardcoding values or calculations, you can use parameters to make your reports more user-friendly and adaptable. Also, users can change parameter values to see different subsets of data, compare different time periods, or customize it.
Parameters can be incorporated into your queries to dynamically filter or transform data. For example, you can use a parameter to filter data based on a specific date range, category, or region.
Also, parameters can be used in DAX by creating calculated columns or measures based on parameter values. For instance, you can calculate growth percentages, moving averages, or rankings based on user-selected parameters.
Conclusion
Mastering advanced data modeling techniques in Power BI offers keys to uncover insightful data analysis. From dynamic visualizations using parameters to navigating complex hierarchies and predicting trends with time intelligence, and so on.
Utilizing these techniques, you are not just analyzing numbers – you’re creating insights to fully maximize the effectiveness of Power BI for data analysis. Now, it’s time to face your data challenges and turn hidden insights into actionable steps!
If you enjoyed reading this, you can also check out these formatting techniques in Tableau and best practices.
Happy analyzing!