
Slicers are key Power BI feature that let users filter data. While a slicer is often associated with a single column, you may also a single slicer to filter data across multiple columns.
By using just one slicer, you can streamline your reports and easily filter data across multiple columns, which not only saves time but as well ensure accuracy and consistency in your reporting, and allow more flexible filtering options.
In this article, I will walk you through the process of creating a Power BI slicer for multiple columns using a sample dataset.
So, let’s get started.
One Slicer for Multiple Columns — How It Works
The one Slicer for multiple columns technique in Power BI allows you to filter data across multiple columns using just one slicer.
For example, imagine you have two columns in your report: “Country” and “Region” and you want to filter data for both columns simultaneously, using two separate slicers can be time-consuming.
However, you can create a “helper” column to concatenate the data from both columns. This column can then be used as a slicer in your report, letting you filter data for both columns simultaneously.
Benefits of Using One Slicer for Multiple Columns in Power BI
In Power BI, there are several benefits to using a single slicer for multiple columns. Below are some of them:
- One slicer for multiple columns simplifies filtering by applying filters to multiple columns at once. This enhances the data processing process
- Combining multiple columns using a slicer simplifies the user interface, as one control lets easily navigate and pick filter choices
- A single slicer ensures filtering consistency across related columns automatically. This ensures data consistency and prevents inconsistent results
- Also, one slicer for multiple columns provides users with the flexibility to analyze data from different columns. This allows for a deeper understanding of the relationships between various data elements within the dataset
- With a single slicer for multiple columns technique, users can explore different filter combinations. This allows users to uncover hidden data insights.
- Finally, this technique saves time and effort. With one slicer, you no longer need to click through multiple slicers to filter your report. This also reduces the risk of errors when selecting multiple slicers.
By leveraging the one slicer for multiple columns feature in Power BI, users can streamline their analysis, improve the user interface, ensure consistent filtering, and uncover hidden data insights.
How to Create a Single Slicer for Multiple Columns in Power BI
Step 1: Import the Data into Power BI
To start with, open Power BI Desktop and click on the “Get Data” option. Then select the dataset you want to work with and import the data into Power BI. This data could be a file, database, or any other supported source.
In this article, I will make use of a sample dataset, which you can download here.
Step 2: Select the Slicer and Table Visuals
After you have successfully imported your data, go to the visualization pane, and select the “Slicer” visual and the “Table” visual.
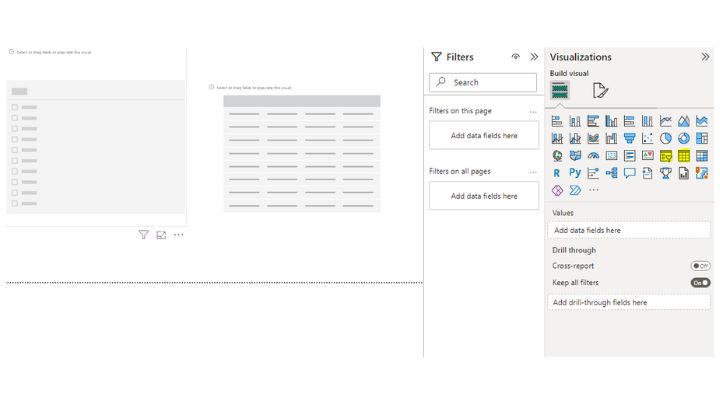
The “Table” visual displays the slicer’s filtered values, providing a dynamic and interactive experience.
Step 3: Drag and Drop Columns into Visuals
In the “Data” pane, identify the columns you want to add to the slicer and drag them into both the slicer visual and the table visual.
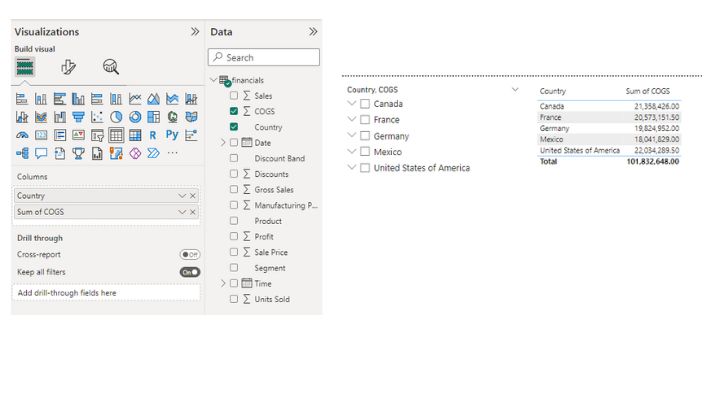
In this example, I will use the “COGS” and “Country” columns to establish a relationship between them.
Step 4: Expand the Slicer to Show Multiple Columns
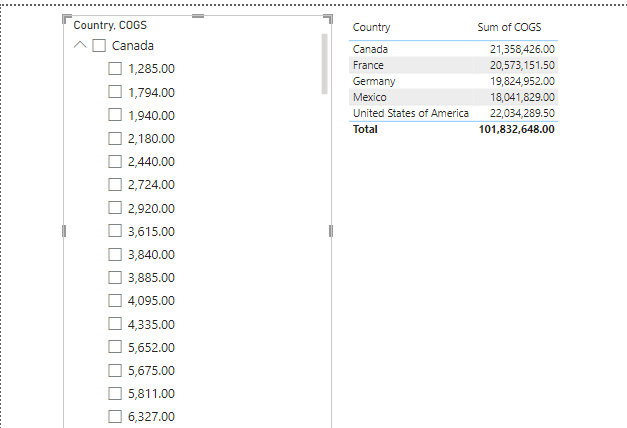
When you add multiple columns to the slicer, it will automatically display an arrow next to the items, which indicates that there are multiple columns. However, you can click on the arrow to expand the slicer and show the items in the columns.
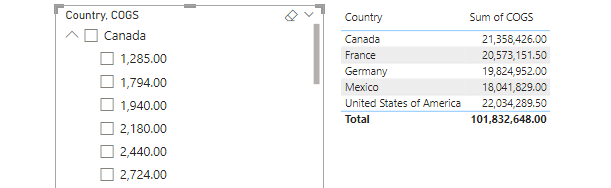
In this example, the first column is the “Country” field, while the next column is the “COGS” field.
Step 5: Apply Filters and View Results
Now that the slicer contains multiple columns, you can now filter values in the slicer visual by simply selecting the desired values in the slicer to apply the filter.
As you make selections, the table visual will update automatically to display the filtered data based on the selected value, as you can see below.
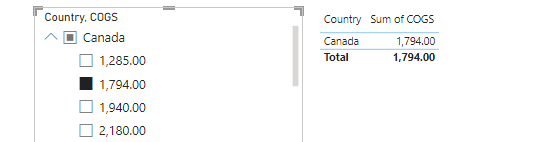
This allows you to dynamically explore the data based on multiple columns simultaneously, refining your analysis as needed.
Step 6: Clear Selections (Optional)
Finally, you may want to remove the slicer filter. To do that, just uncheck the value option in the slicer visual.
This will reset the slicer and remove the applied filter from the visuals, allowing you to start with a clean slate or apply different filters.
Common Mistakes to Avoid When Using One Slicer for Multiple Columns in Power BI
While using a single slicer for multiple columns is an effective Power BI feature, below are several common errors to avoid:
- Ensure the data in your Power BI slicer columns are compatible and formatted — inconsistent data types might cause filter errors
- Do not forget to establish proper relationships between the calculated column used for the slicer and the original columns. Ignoring this step can lead to inaccuracy or no filtering at all
- Customizing slicer headers and visuals improves user experiences. Failing to provide a clear and concise slicer appearance can make it challenging for users to understand and interact with the slicer effectively
- Also, before publishing your Power BI reports, test the slicer interactions and filter combinations. Not doing so may result in incomplete data filtering, leading to incorrect analysis or wrong insights
- Finally, be conscious of the size of your slicer. You might end up with a report that is too big for the slicer if you choose too many columns.
By avoiding these common errors, you can guarantee a seamless and accurate experience when using a single slicer for multiple columns in Power BI, thereby improving your data analysis and visualization process.
FAQs: How to Create a Single Slicer for Multiple Columns in Power BI
Are there limitations or considerations when using a single slicer for multiple columns in Power BI?
While a single slicer for multiple columns is a great feature, there are a few things that must be considered such as accurate data modeling and column selection, slicer visual design to improve user experience, etc.
Can I include unrelated columns in a single slicer?
No. I do not recommend you include unrelated columns in a single slicer. To ensure accurate filtering, you should always select related columns.
How to manage slicer selections when using multiple columns?
To effectively manage slicer selections, allow users to discard selections and reset the slicer.
Can I include too many columns in a single slicer?
No, it is not advisable to include too many columns in a single slicer.
It is best to keep the slicer concise and focused on relevant columns to maintain clarity and ease of use.
How do I ensure the correct data relationships for a slicer with multiple columns?
To ensure the correct data relationships, verify and establish the relationships between the slicer column and the associated columns to ensure the slicer filters the data accurately. Also, double-check the relationships to avoid inconsistencies.
Conclusion and Final Thoughts
In conclusion, we have learned how to create a single slicer for multiple columns in Power BI to streamline your reports and enhance the user experience.
By following this article, you can now leverage the flexibility of Power BI slicers to filter data based on multiple criteria simultaneously to uncover hidden data insights.
So, you can experiment with different column combinations to unleash the full potential of Power BI slicers!
I hope you understood these steps. You can also check out our article on how to reference Slicers values in a Power BI column formula.
Thanks for reading!