Generally, forecasting is crucial in business analytics, aiding planning, budgeting, strategy development market analysis, risk management, and so on. Fortunately, Power BI — a powerful data visualization tool, offers several forecasting techniques.
This article delves into the world of forecasting in Power BI, exploring both the process and best practices for implementing data forecasts in Power BI.
Let’s get started!
Introduction to Forecasting in Power BI
Forecasting involves predicting future values using historical data to analyze trends. Power BI allows users to integrate advanced algorithms and visualization capabilities to provide users with the tools they need to generate meaningful forecasts.
With forecasting in Power BI businesses can identify risks and inventory management which provides opportunities for strategy and management. Thus, leveraging forecasting abilities can aid budgeting, planning, resource allocation, and so on.
The following are some popular forecasting techniques:
Moving Average
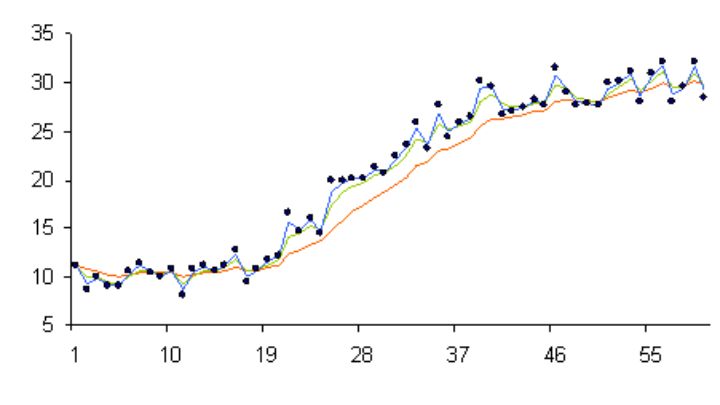
Moving average is a very simple, but effective forecasting technique, calculating the average of a specific number of data points over a defined period. It helps to filter out short-term inconsistencies and identify trends and patterns.
Common types of “Moving Average” include the Simple Moving Average (SMA) and the Exponential Moving Average (EMA).
Exponential Smoothing
Exponential smoothing is a statistical method that applies exponentially decreasing weights to past observations, which gives more weight to more recent data. It is very effective for time series forecasting.
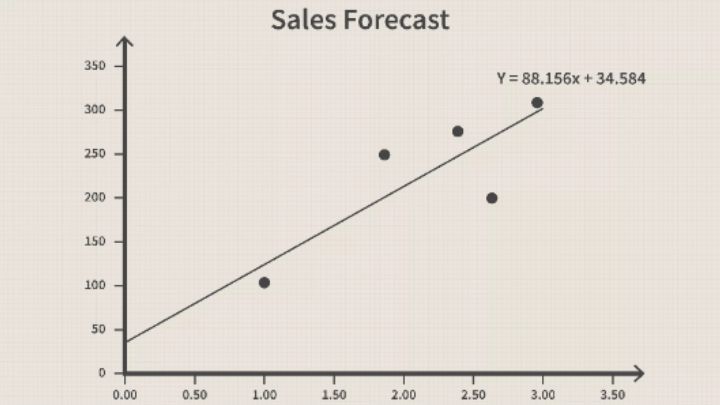
Regression Analysis
Regression analysis is a statistical technique used to identify relationships between two or more variables. It helps to understand how these variables on the forecasted values, which may be linear or nonlinear.
How to Forecast Data in Power BI – A Guide
To get started with data forecasting in Power BI, there are a few prerequisites you need:
- Power BI Desktop
- Dataset
1. Import the Data
To start with, open your Power BI Desktop and import the dataset you want to work with into Power BI. This could be an Excel spreadsheet, a SQL Server database, or various other data connectors.
2. Clean and Transform your Data
After this, clean and transform your data in Power BI using the Power Query Editor. Address missing values, remove duplicates, and ensure data quality.
You can also design your data model, like defining relationships between tables, creating calculated columns and measures, etc.
3. Forecasting
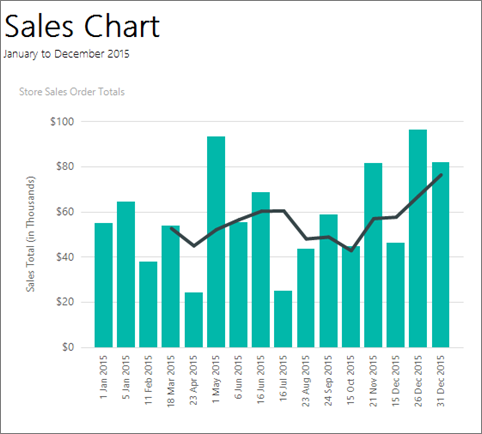
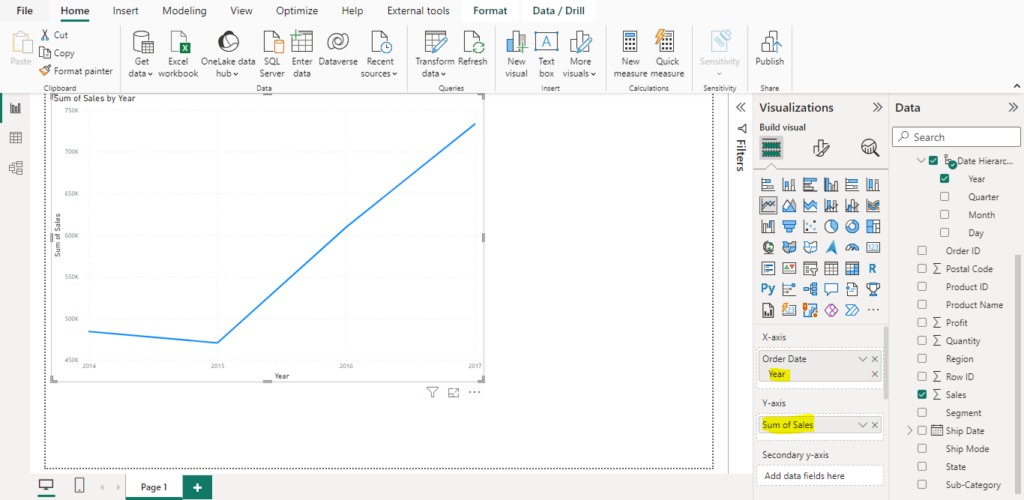
Now to forecast your data, the first thing to do is to select a visualization (e.g., line chart) to show your data and forecasts.

If you like, you can resize the chart to suit your needs. Now, you can start filling in the visual by dragging and dropping columns into the (X-axis and Y-axis) in the visualization pane.
For example, in my chart, I used the columns (Sum of Sales by Year) to create the chart below.
Now, the next step is to generate the forecast of the Sum of Sales by Year. To do that, go to “analytics” under the “Visualizations” pane to activate the forecast option.
PS: If you cannot find the forecast option in the “analytics” tab, then there is a problem with your data (especially the date column). Your data must at least contain a four-year period before you can forecast data.

You can then configure your forecast by expanding the forecasting options, including the forecast length (how long you want to forecast), the confidence level, seasonability, etc.
Finally, review your forecasted data, evaluate its accuracy, and make necessary adjustments if need be.
4. Visualization and Reporting
Now that you have created your forecast, you can use it for your reports and dashboards to showcase certain metrics.
Best Practices for Effective Data Forecasting in Power BI
While forecasting has no one-size-fits-all model for accuracy, some best practices can help users get reliable forecasts. Here are some best practices for effective data forecasting in Power BI:
1. Understand Your Data
You must fully understand your data before choosing a forecasting technique. This is because different techniques suit different types of data patterns.
2. Clean and Prepare Data
To generate accurate and reliable forecasts, you must clean and prepare your data. Always identify and handle missing values and outliers before creating your forecasting model.
3. Experimentation
Experimentation allows you to find the most accurate model for your dataset. So, trying out multiple algorithms can help you get the most suitable and accurate model.
4. Update Regularly
As your data gets updated, always refresh your forecasts to reflect the latest trends to keep your forecasting model up to date.
5. Visualize Results
With in-built visualizations in Power BI, you can create interactive dashboards and reports that will communicate trends and patterns to stakeholders.
FAQs: Power BI Forecasting Techniques and Best Practices
Is it possible to forecast data in Power BI without knowledge of forecasting techniques?
Yes, Power BI provides built-in forecasting capabilities that allow users to forecast data even without prior knowledge of forecasting techniques. However, understanding forecasting basics might help you better analyze your findings.
What is the best way to handle missing data in Power BI?
To handle missing data in Power BI, you can choose to ignore the missing values, insert them based on existing data, or use advanced techniques like regression or exponential smoothing to estimate missing values.
Are there any limitations to data forecasting in Power BI?
Yes, data forecasting in Power BI depends so much on historical data trends and patterns for forecasts. However, if there are changes, the forecasted results may not be reliable.
Are custom forecasting models allowed in Power BI?
Yes, Power BI allows users to leverage custom forecasting models through R or Python scripts in Power BI projects. This gives users the flexibility to implement advanced forecasting algorithms and models.
Conclusion
Data forecasting in Power BI is a powerful capability that can provide valuable insights for your business.
By understanding the basics of forecasting, and following the best practices explored in this article, you can unlock the potential of data forecasting in Power BI!
If you are interested in further exploring Predictive Analysis, you can also read this insightful article on how forecasting works in Tableau.
Happy analyzing!