Forecasting, in general, is the process of predicting values for a certain measure within a specific time period. However, Tableau employs exponential smoothening for accurate forecasts and provides comprehensive forecast insights.
These insights ensure comprehensive analysis and allow users to understand the underlying factors influencing the data by exploring different techniques, identifying outliers, and drilling down into specific data points.
In this article, I will delve into Tableau forecasting, how to create a Tableau forecast, and as well its significance in making informed decisions.
Let’s get started!
How to Create Forecasts in Tableau
Let’s go through how to create a forecast in Tableau!
To create a forecast, you need to install the Tableau software and a dataset. For this guide, I will make use of the IMDB (2006 — 2016) dataset. It contains data on movies released during that period. You can download it here.
Now, let’s go on to create a forecast using Tableau!
1. Load the data source into Tableau
The first thing is to launch your Tableau Desktop and load the data source into it. To do that, click on the appropriate data source you want to work with.
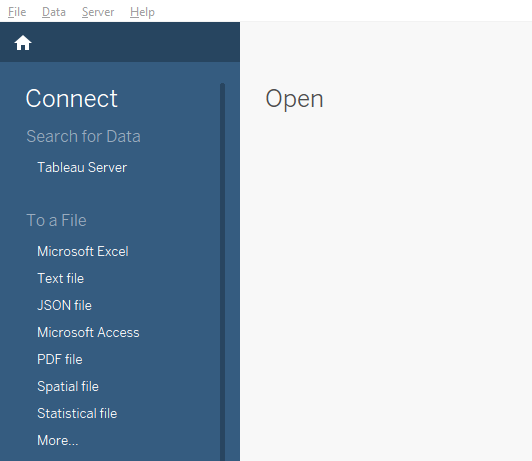
My dataset is in Microsoft Excel format. So, I will select “Microsoft Excel” as the data source, and choose the file on my computer.
2. Drag the Year Dimension Into the Columns Region
Once you load the data source, you can drag Year into the “Columns” region and Revenue into “Rows.” This will give you a line chart displaying the time series.
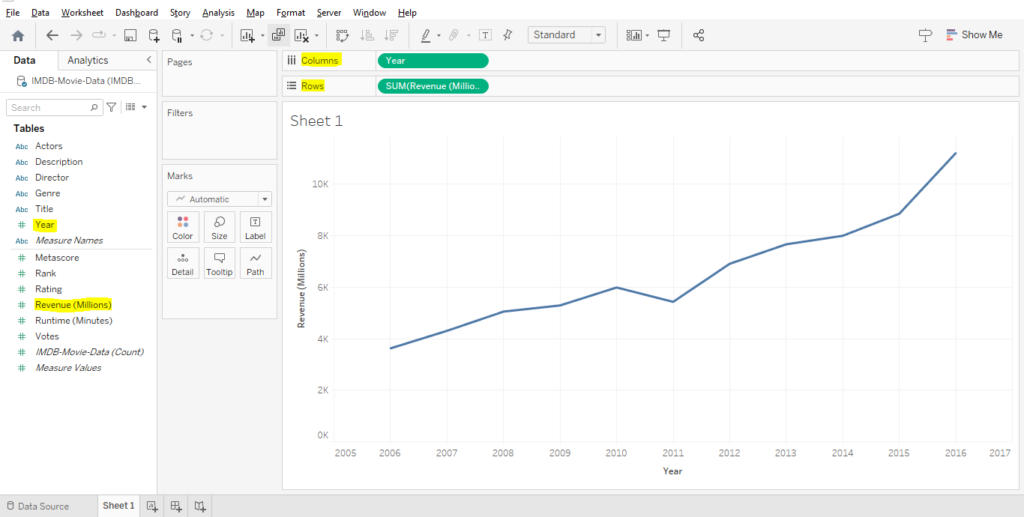
As you can see, the Year function was applied, which makes the chart to be displayed based on the years 2006 — 2016.
3. Generating a Forecast
Now, to generate a forecast based on the data, go to the “Analysis” menu and hover your mouse on “Forecast” then select “Show Forecast.”
(As shown below)
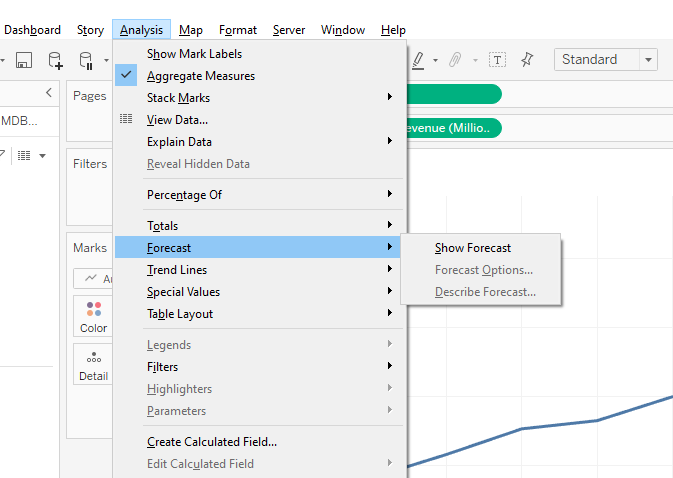
This process will create a forecast measure, indicated by a blue shade around the actual forecast line.
(As displayed below)
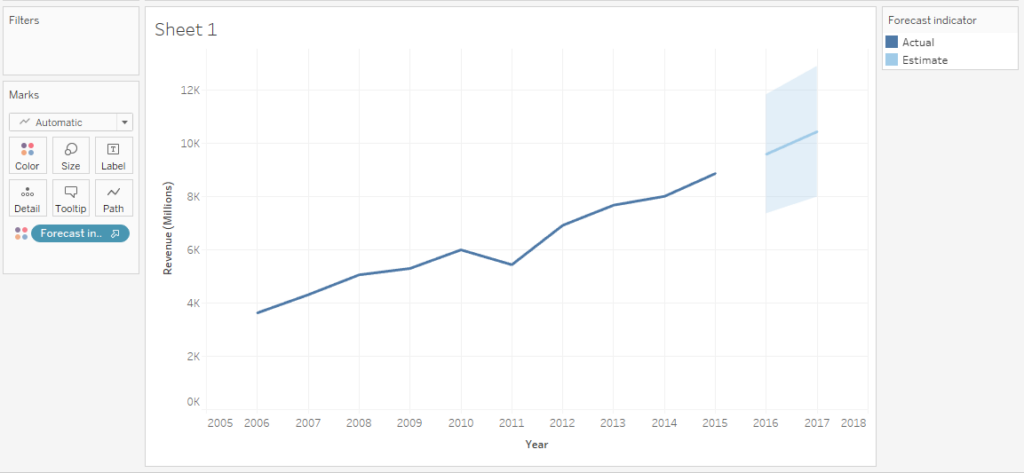
Yes! That’s how to create a forecast in Tableau!
4. Exploring Forecast Options
Now that you can create a Tableau forecast, let us explore some forecast options!
Again, go to “Analysis,” then hover your mouse on “Forecast” and select “Forecast Options.”
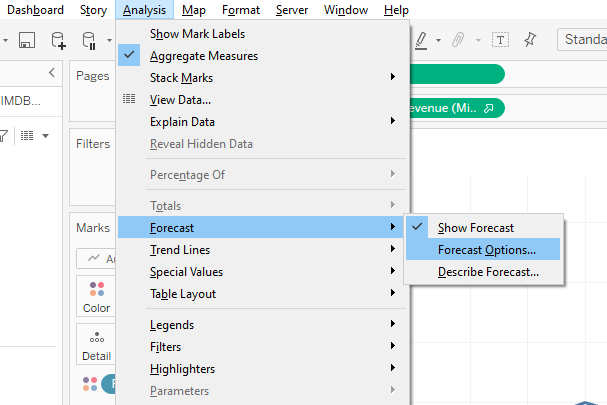
In the “Forecast Options” box, you can customize different settings such as forecast length, aggregation level (e.g., years, quarters, months), and forecast model.
Let’s go through some of these forecast options!
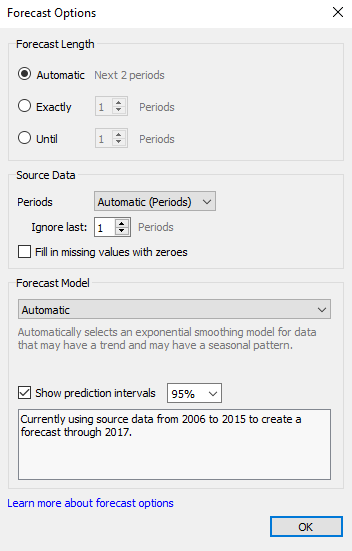
a. Forecast Length
In the “Forecast Length” section, Tableau provides 3 options: “Automatic, Exactly, and Until.” By default, the “Automatic” option is selected which generates a 12 months forecast.
The “Exactly” option will extend the forecast for a specific number of time units, while “Until” will extend the forecast until a specified period in the future.
I will recommend you try out different values with both the “Exactly” and “Until” options to explore their impact on your forecast.
b. Source Data
In the “Source Data” section, there is a “Periods” option where you have a drop-down menu of forecast periods such as Years, Quarters, Months, Weeks, Days, Hours, Minutes, and Seconds.
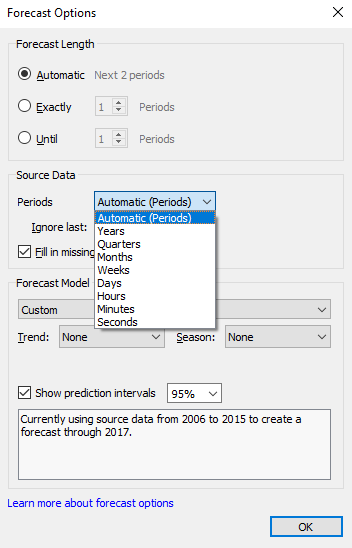
Selecting any of the time periods adjusts the granularity of the forecasted data. This allows you to explore different time periods based on your specific needs.
c. Forecast Model
Just as shown below, Tableau offers three “Forecast Model” options which are “Automatic,” “Automatic with Seasonality,” and “Custom.”
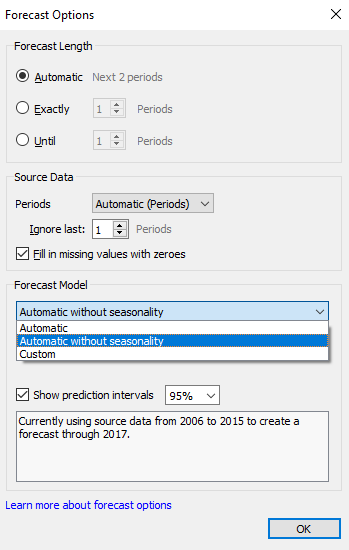
- Automatic: By default, this option selects the right forecasting model considering both trends and seasons. It considers the time series patterns to generate an accurate forecast.
- Automatic with Seasonality: This option takes into account the seasonality component in your data. So, you can use the option when your data contains seasonal trends to avoid inaccurate forecasts.
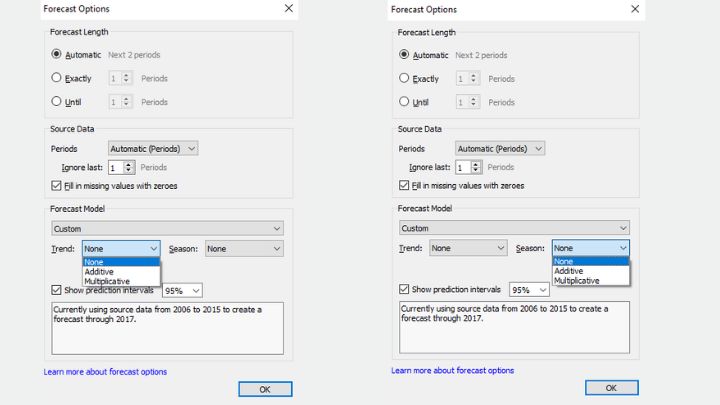
- Custom: The option lets you have more control over the forecast model. It allows you to select specific Trend and Season options based on the data features. There are 3 options to choose from: None, Additive, and Multiplicative.
- None: This means that the corresponding component will not be considered in the forecast model.
- Additive: The option assumes that the trend and seasonality components have a linear relationship and are added together.
- Multiplicative: This option assumes the trend and seasonal components multiply with each other.
You should note that choosing a suitable forecast model is crucial for accurate predictions. So, your choice of forecast model should align with the underlying trends and patterns of your data.
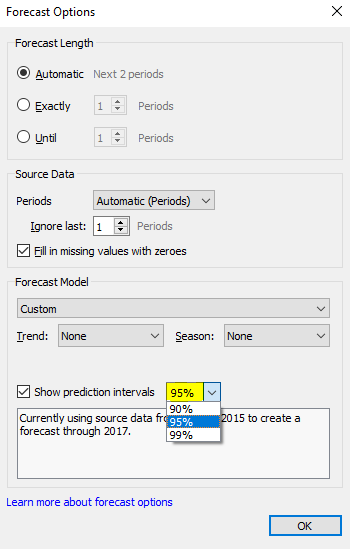
d. Prediction intervals
Prediction intervals define the range within which the forecast values are expected to fall with a certain level of confidence.
For example, if a prediction interval is set at 95%, it means that you are 95% confident that the predicted values will fall within the range predicted by the forecast model.
5. Describing Forecast
Finally, after creating your forecast, it is important to gain detailed insights into the forecast and to do that, you can use the “Describe Forecast” feature.
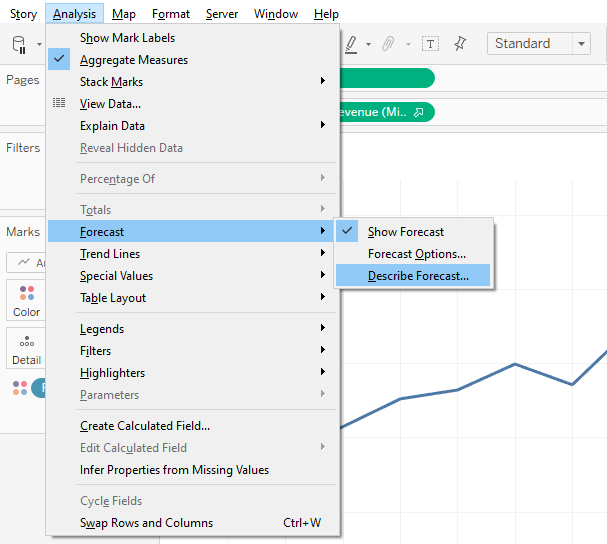
The “Describe Forecast” feature allows you to access a summary of the forecast, including metrics such as the quality of the model.
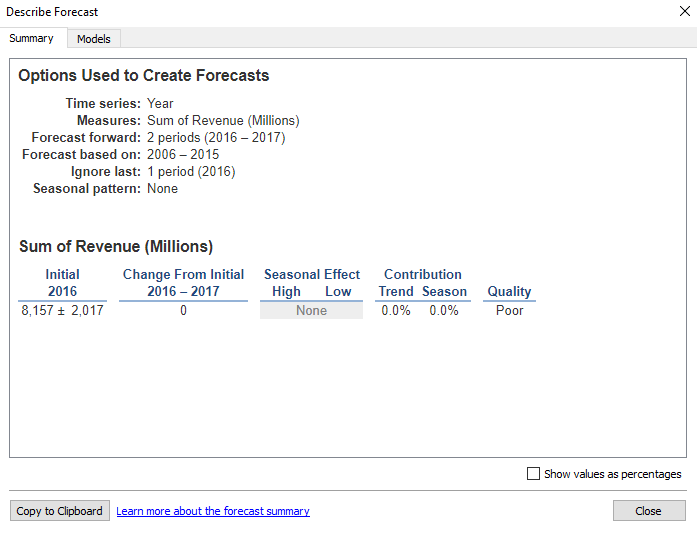
Besides, the summary may show metrics in percentage, which offers you a clearer view of the accuracy and reliability of the forecast.
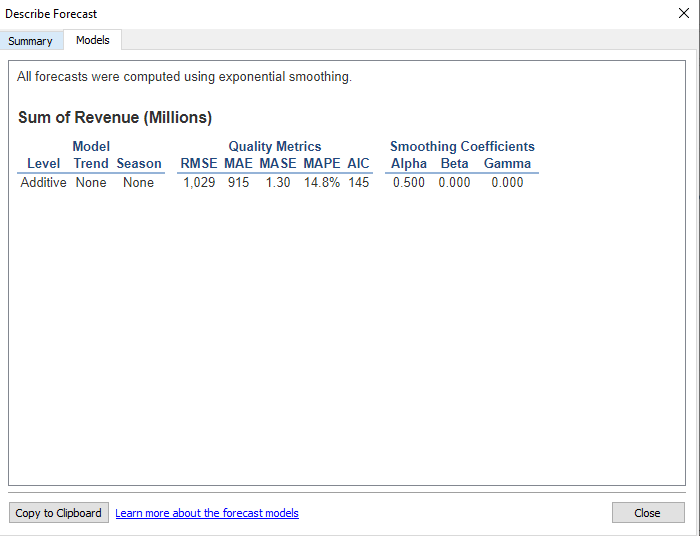
Finally, the “Model” tab provides further insights into the technical part of the forecast model. This section delves into the detailed algorithms, techniques, and parameters used by Tableau to generate the forecast.
Significance of Forecasting in Tableau
- Prediction: At the core of forecasting is prediction. This allows organizations to predict future trends such as sales volumes, demands, customer behavior, etc., to help make informed decisions.
- Strategic Planning: If properly done, forecasting helps facilitates strategic planning by providing insights into future performance. Hence, organizations can use the Tableau forecasting feature to set goals, effective allocation of resources, etc.
- Budgeting and Financial Planning: Forecasting is crucial in budgeting and financial planning. It enables organizations to project future revenue, expenses, and cash flows, facilitating accurate financial forecasts. It supports the creation of reliable financial models and aids in the budgeting process.
- Risk Management: Forecasting also supports risk management by analyzing historical data and predicting future outcomes. It helps organizations identify potential risks, formulate strategies, and make informed decisions.
- Performance Evaluation: Also, forecasting in Tableau allows organizations to evaluate performance by comparing actual results with predicted outcomes. This helps assess forecast accuracy, identify areas for improvement, and make necessary changes.
In summary, forecasting in Tableau allows organizations to predict trends and patterns, make informed decisions, manage resources, and make plans by leveraging historical data and advanced analytics.
Conclusion
The forecast feature in Tableau allows users to generate accurate and insightful forecasts based on historical data. By following this article, you can leverage this feature to uncover trends and patterns.
Whether you’re predicting sales, analyzing market trends, or forecasting resource allocation, the Tableau forecast feature allows you to make data-driven decisions!
I hope you enjoyed reading this article. You can also check out our article on tips for creating an engaging Tableau dashboard.
Thanks for reading!