
Tableau is a popular software that makes it easy to create stunning visuals and dashboards. If you are looking for inspiration for your own Tableau dashboard examples, then you have come to the right place.
A well-designed Tableau dashboard can concisely convey complex information, making it easier for decision-makers to understand and act on insights.
In this article, I will explore ten Tableau dashboard examples that will inspire you and help you learn how to create effective data visualizations and dashboards.
Let’s dive right in!
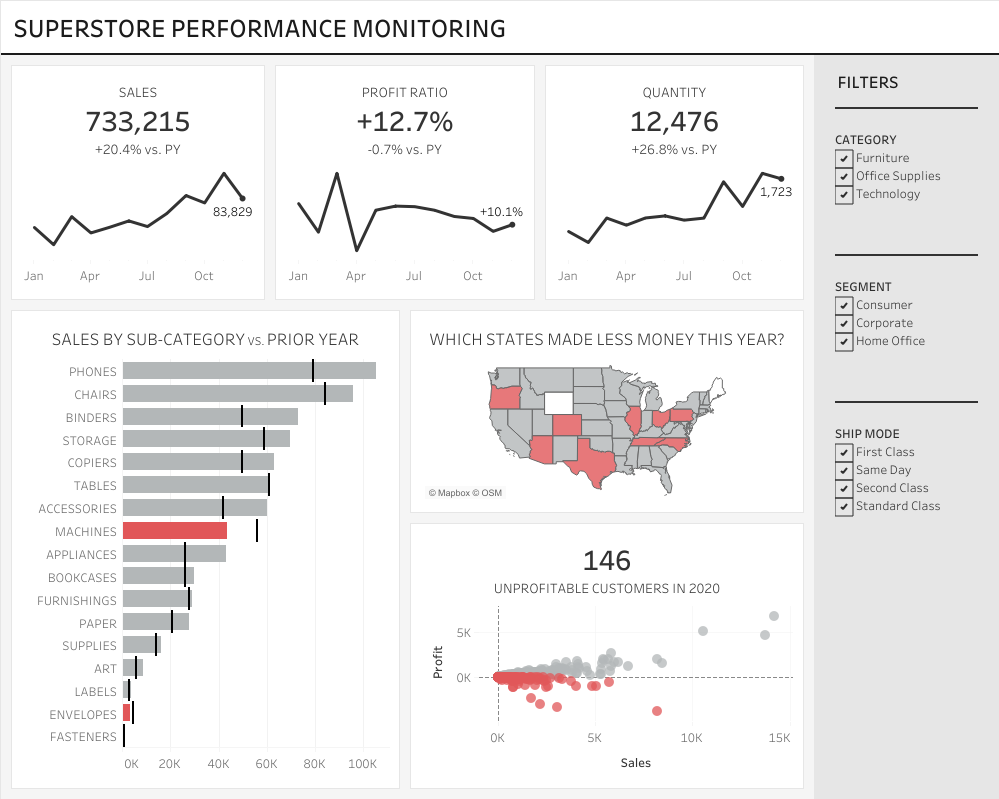
1. Sales Performance Dashboard
The Sales Performance Dashboard is an excellent example of how Tableau can be used to display sales data.
It often includes key metrics such as profit, revenue, sales by region sales by quantity, ship mode, and so on.
With features like filters and charts, the sales performance dashboard provides an extensive view of sales performance that can help businesses make informed decisions and drive growth.
Below is an example of a Sales Performance Dashboard:
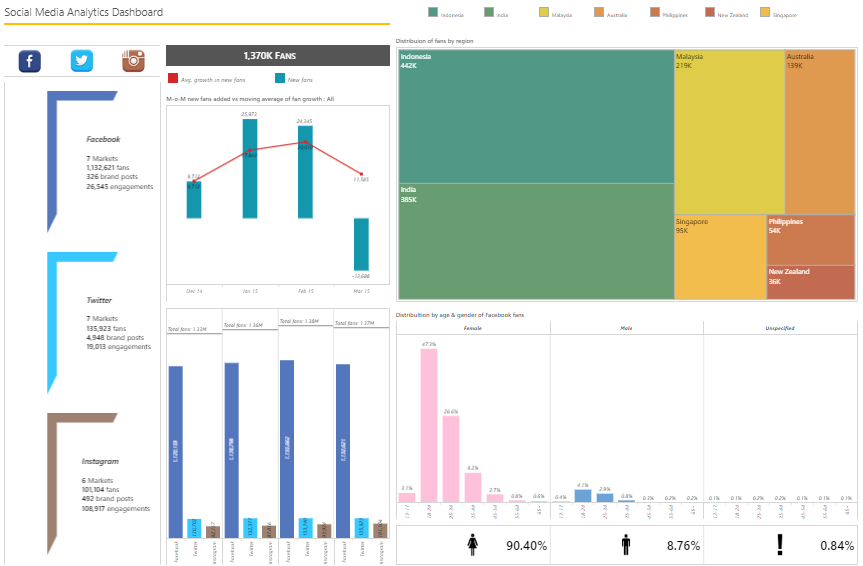
2. Social Media Analytics Dashboard
This social media analytics dashboard is designed to help social media managers track and analyze social media key metrics such as engagement, reach, follower growth, etc. which makes it easier to identify performing posts and the ones that need improvement.
With features like filters and interactive charts, this dashboard can provide a comprehensive view of social media performance that can help businesses optimize their social media strategy and improve their online presence.
Here is an example of a social media analytics dashboard:
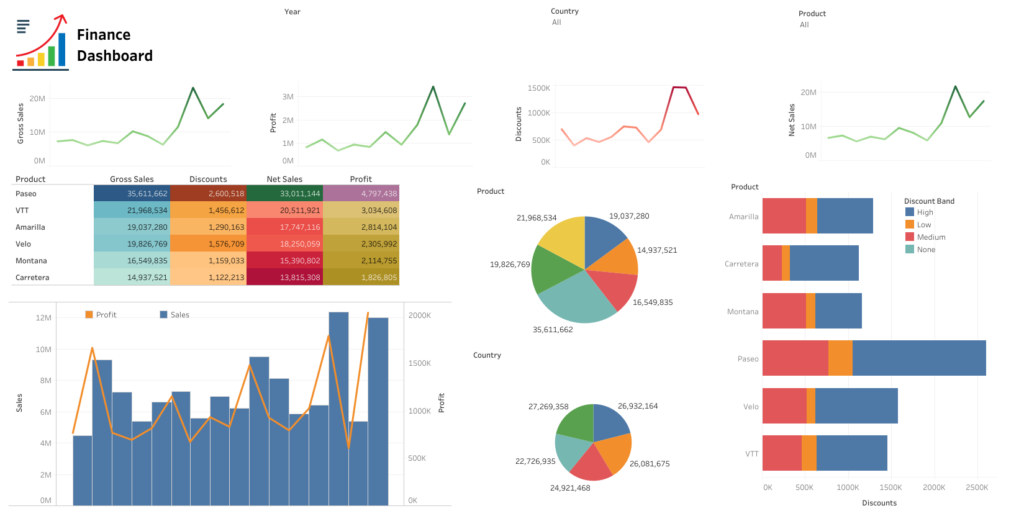
3. Financial Dashboard
The financial dashboard shows how Tableau can be used to track and analyze financial data. It primarily includes key financial metrics such as revenue, expenses, profit, etc.
With features like drill-down capabilities and interactive charts, this dashboard can provide a comprehensive view of financial performance that can help businesses make data-driven business decisions.
Below is an example of a Financial Dashboard:
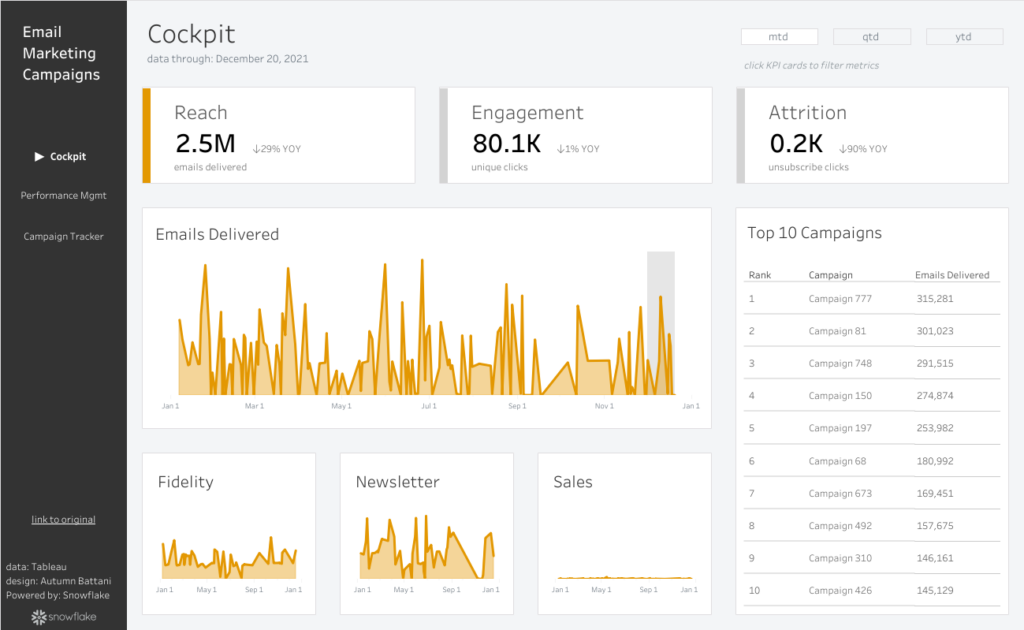
4. Marketing Campaign Dashboard
Marketing Campaign Dashboards are designed to help marketers track the effectiveness of their campaigns. It often shows stages of marketing campaigns, conversion rate, campaign performance across different channels, etc.
Also, the dashboard allows customers to filter by date range and channel, which makes it easy to see performing campaigns, and the ones that require improvements.
Here is an example of a Marketing Campaign Dashboard:
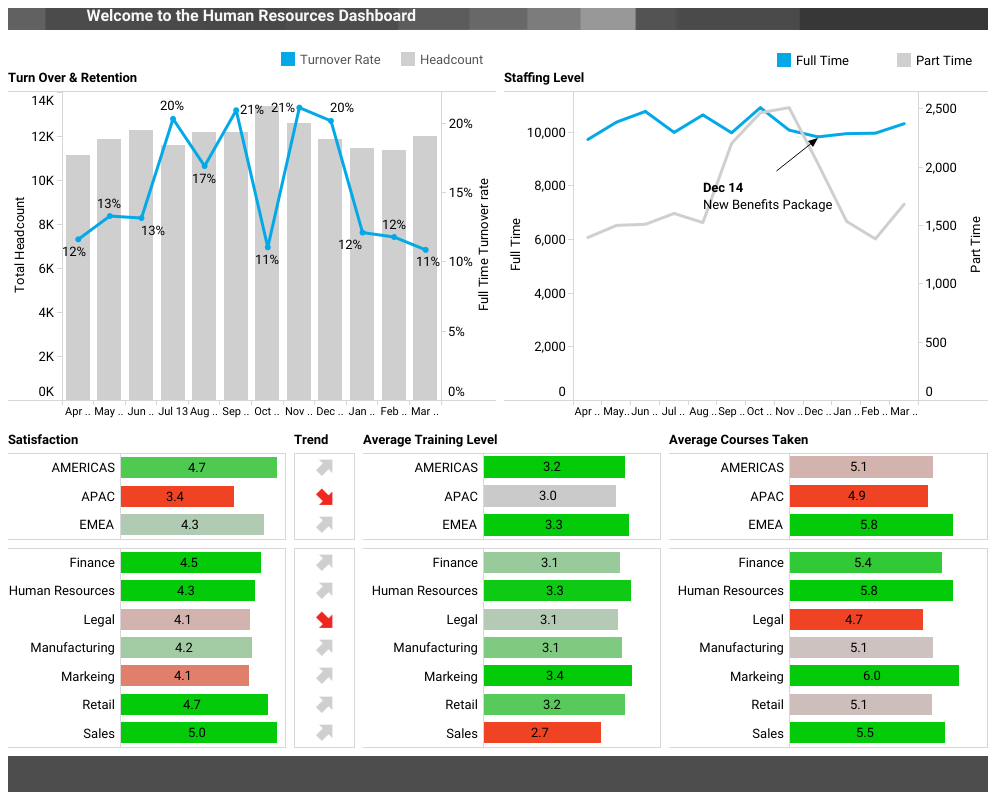
5. Human Resources Dashboard
This type of Dashboard helps HR managers track key metrics such as headcount, turnover, and employee satisfaction. It also allows users to filter by department, date range, etc., making it easy to identify areas that need improvement.
Here is an example of a Human Resources Dashboard:
6. e-Commerce Dashboard
This type of dashboard helps eCommerce businesses track key metrics such as conversion rate, average order value, revenue, etc.
The dashboard often includes conversion rates of every stage of purchases, the correlation between average order value and revenue, etc. It can also include a chart comparing revenue across different product categories.
Here is an example of an eCommerce Dashboard:

7. Healthcare Dashboard
The Healthcare Dashboard helps healthcare professionals track key metrics such as patient outcomes, readmission rates, length of stay, etc.
It often includes charts showing lengths of stay over time, a chart comparing patient outcomes across different hospitals, and so on.
Below is an example of a Healthcare Dashboard:

8. Customer Churn Dashboard
The purpose of the Customer Churn Dashboard is to provide insight into customer churn and aid in the process of reducing it. It allows users to filter by region and customer segment, hence, making it simple to zero in on problem areas.
It often includes charts showing customer churn rates by region, churn rates over time, churn rates by customer segment, and so on.
Here is an example of a customer churn dashboard:

9. Supply Chain Dashboard
This Supply Chain Dashboard helps supply chain managers track key metrics such as lead times, inventory levels, delivery performance, etc. It includes visuals showing delivery performances, inventory levels over time, and so on.
Oftentimes, the supply chain dashboard allows users to filter by supplier and date range, making it simple to identify improvement areas.
Here is an example of a supply chain dashboard:

10. Education Dashboard
This Education Dashboard is designed and used by educators to track key metrics such as student attendance, enrollment, and performance to identify areas where students need more support and optimize teaching strategies.
Here is an example of an Education Dashboard:

FAQs
What are the benefits of using Tableau dashboards?
Some benefits of using Tableau dashboards include improved data analysis, better decision-making, more efficient communication of insights, increased team collaboration, etc.
Can you customize the Tableau dashboard examples in this article?
Yes, the Tableau dashboard examples in this article can be customized to suit your specific needs.
You can add or remove data sources, change visualization types, and modify the layout and design of the dashboard.
Do you need programming skills to create Tableau dashboards?
No, Tableau provides a user-friendly interface that allows users to create dashboards without any programming skills.
However, some advanced customization may require knowledge of scripting languages such as SQL and Python.
Is Tableau the only tool for creating data visualizations and dashboards?
No, there are other tools for creating data visualizations and dashboards, such as Microsoft Power BI, QlikView, and Google Data Studio.
However, Tableau is one of the most popular and widely used tools in the industry.
Conclusion
In summary, these ten Tableau dashboard examples demonstrate the impressive capabilities of data visualizations. With Tableau, you can turn boring spreadsheets into interactive and engaging visuals.
Whether you are in marketing, finance, healthcare, or any industry, Tableau dashboards can provide valuable insights that can help your organization make better decisions.
So, why settle for boring visuals when you can create engaging and interactive Tableau dashboards?
I hope you enjoyed reading this article.
Thanks for reading!