
Cumulative total, also known as running total, is a method of summarizing data by adding up the values of a field over time. But do you know how to calculate cumulative total in Power BI?
In this article, I will walk you through a step-by-step guide on how to calculate cumulative total in Power BI using a DAX formula.
Let’s get started.
Introduction: How to Calculate Cumulative Total in Power BI
In Power BI, cumulative total accumulates the sum of a field over time and gives a snapshot of the total amount of a particular field at any given point.
This allows users to see the trends, patterns, and growth over time and provides valuable insights into the data which can be used for various types of data such as sales, expenses, and so on.
To calculate the cumulative total, you can follow the steps below:
Get the data
The first thing to do after opening your Power BI is to import the data you want to work with into the Power BI Desktop.
Create a calculated column
The next thing to do is to create a calculated column. To do that, go to the Fields tab, and select the data table you want to calculate the column. Then right-click and select New Column.
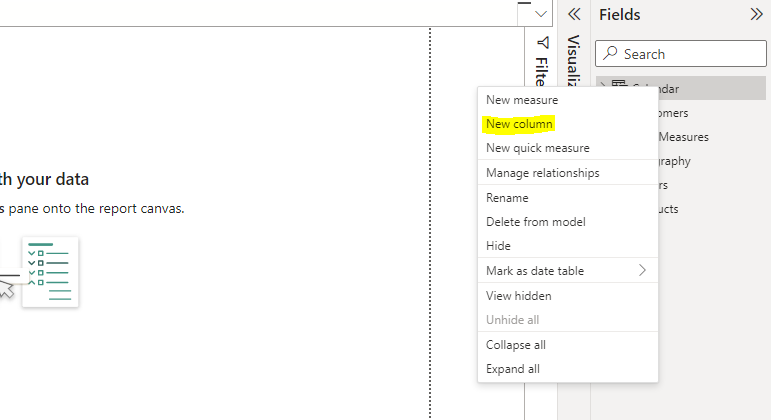
This process will show a dialog box where you can enter a name for the column and the formula for the cumulative total (as displayed below).
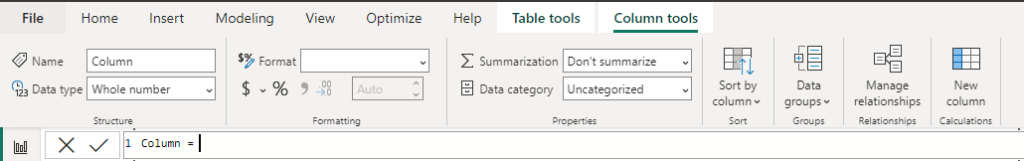
Enter the formula
Now, you will enter the cumulative total formula. To do that, enter the following DAX formula:
CumulativeTotal = CALCULATE(SUM(Table[Field]), FILTER(ALL(Table), Table[Field] <= MAX(Table[Field])))You will replace Table with the name of your data table, and Field with the name of the field you want to calculate cumulative total for.
Create a visual
Now, you can create a visual, such as a line chart, matrix table, etc. to show the cumulative total you just calculated.
Format the visual
Finally, you can format the visual as you like, such as changing the color coding, adding a title, tooltips, etc.
Now, that is it! You should now see the cumulative total for the specified field in your Power BI report.
FAQs
Are cumulative and total the same?
No, they are not the same. Total refers to the complete quantity of something, while cumulative is the accumulation of multiple quantities up to a certain point.
What is the difference between rolling sum and cumulative sum?
The difference lies in their calculation methods.
A cumulative sum adds up all values from the starting point, resulting in a running total, while a rolling sum looks at a specific time frame, such as 30 days, and calculates a new sum continuously, taking only the values within that time window into account.
Conclusion: How to Calculate Cumulative Total in Power BI
In conclusion, you can easily calculate the cumulative total by creating a column using the CALCULATE function, summing the desired column, and filtering it based on the date.
The result can then be visualized using a chart or graph, allowing for clear visualization of the data.
If you enjoyed reading this article, you can also check out how to calculate date differences in Power BI Using DAX.
Happy analyzing!