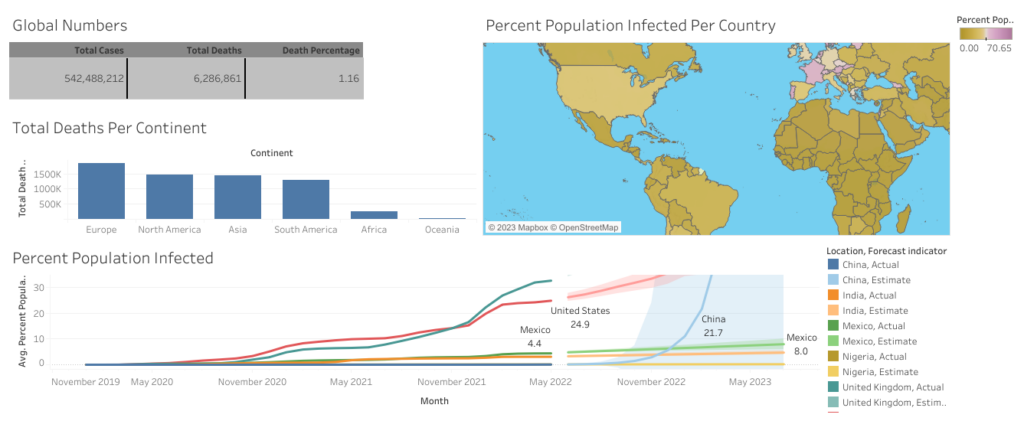
Tableau is a data visualization tool that helps businesses and organizations analyze and turn complex data sets into clear and easy-to-understand visuals.
With its user-friendly interface and robust features, Tableau has become a popular choice for businesses, allowing users to create interactive dashboards, reports, and charts. This enables businesses to explore data insights and make data-driven decisions.
In this article, I will explore what Tableau is, its benefits, and how it can help businesses gain valuable insights from their data.
Let’s go.
What Is Tableau and How Does It Work?

Tableau is a business intelligence tool that allows users to connect, create, and visualize data. It provides various tools and features that make it easy to connect to different sources for data analysis and to create fascinating visuals such as charts, graphs, etc.
Also, it is designed to be user-friendly, with a drag-and-drop interface, allowing users to create visuals without the need for advanced programming skills.
Finally, just like Power BI, Tableau allows for connecting to various data sources, such as spreadsheets, databases, and cloud-based services. It also allows for collaboration and sharing of data and visuals with others.
How to Get Started With Tableau
To get started with Tableau, you will need to download and install the software. Once you install it, you can connect to your data sources and begin creating visualizations.
This video tutorial will help you set up and get started.
It is important to have a clear understanding of your data and what insights you hope to gain from it before diving into creating visualizations.
However, with constant practice and dedication, you can become proficient in using this tool to get the best out of your data and drive better business decisions.
The Benefits of Using Tableau for Data Visualization
Tableau provides a range of benefits for businesses and organizations that need to analyze and visualize their data. Some of its key benefits include:
Easy to Use
To start with, Tableau’s drag-and-drop interface makes it easy for users to create visuals without requiring a high level of technical expertise.
Fast and Efficient
In addition, Tableau’s in-memory data engine allows for the efficient processing of large data sets, making it easy to explore and analyze real-time data.
Interactive and Dynamic
Tableau’s interactive and dynamic visuals enable users to explore data and draw insights. This makes it easy to make data-driven decisions.
Accessibility
Furthermore, it provides a range of tools and features that make it easy to share visuals and insights with others, making it accessible to stakeholders across the organization.
Customizable
Finally, Tableau’s highly customizable, allowing users to create visuals that fit their specific needs and requirements.
Understanding the Different Types of Data Sources and How to Connect Them
Tableau allows users to connect to different data sources, such as Microsoft Excel, SQL, and cloud-based services like Salesforce, Google Analytics, etc.
When connecting to a data source, it is important to understand the structure of the data and how you can use it. For example, some data sources may require extra formatting before you can use them in visuals.
However, Tableau offers a variety of tools and resources to help users connect to and work with their data sources, such as data connectors, data preparation tools, and other data blending capabilities.
With a clear understanding of your data sources and how to connect them, you can easily create powerful visualizations that help you gain insights and make better business decisions.
Creating Effective Visualizations and Dashboards With Tableau
When creating visuals, it is important to consider the audience and the purpose of the visual. For example, a marketing dashboard may include metrics like website traffic, social media engagement, and email campaign performance.
Tableau offers different visualizations, including bar charts, line charts, scatter plots, heat maps, etc. Also, you can create custom visuals using R and Python.

Hence, you can create interactive dashboards that allow users to explore and interact with the data, gaining insights and making better decisions.
FAQs
Is Tableau free?
No, it is not free. However, Tableau offers a free version of its software called Tableau Public but has limited functionality.
Does Tableau offer mobile access?
Yes, Tableau provides mobile access to its visualizations through the Tableau Mobile app, which is available for iOS and Android devices.
Is Tableau cloud-based or on-premise software?
Tableau offers both cloud-based and on-premise software options.
Conclusion
With Tableau’s user-friendly interface, efficient data processes, and ability to handle big data, it is a valuable asset for data analysis and visualization.
So why not give it a try and see where your data can take you? Who knows, you may just uncover some surprising and delightful insights along the way!
I hope you enjoyed reading this article.
Thanks for reading!
