
Generally, filtering the Top “N” items is a common requirement in business reporting as it is easily understandable. In this article, I will explain a step-by-step method on how to get the Top “N” items using a Power BI matrix table.
Let’s get started.
Introduction
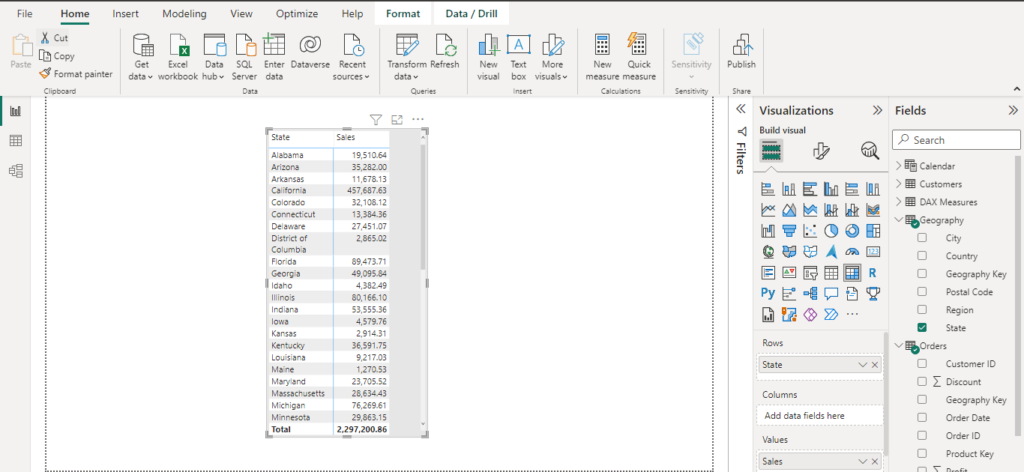
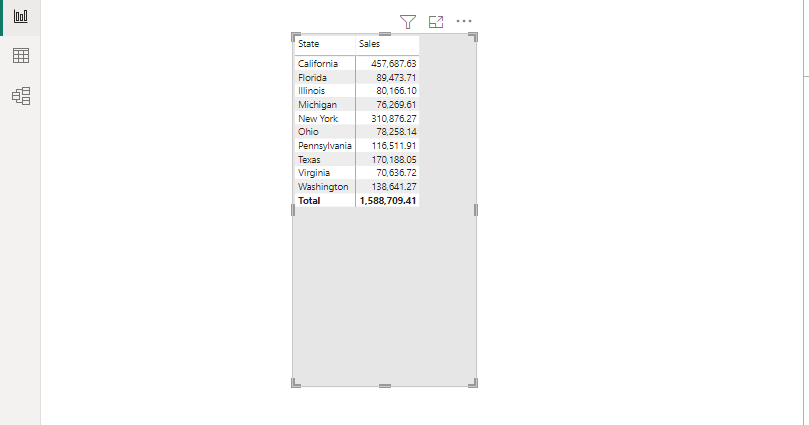
To get started, make sure you have your dataset inserted into Power BI Desktop. In the Fields panes, select the tables you want to work with and select Matrix Table in the Visualization pane.
In this example, I used State and sorted by Sales. So, I have a table of sales from every state in the dataset.
Filter the Top “N” Items
Now, I want to filter the top “N” sales in the data. “N” here will be 10. That means I will be filtering the top 10 Sales by States in the data.
To do this, I will make use of the Filters pane.
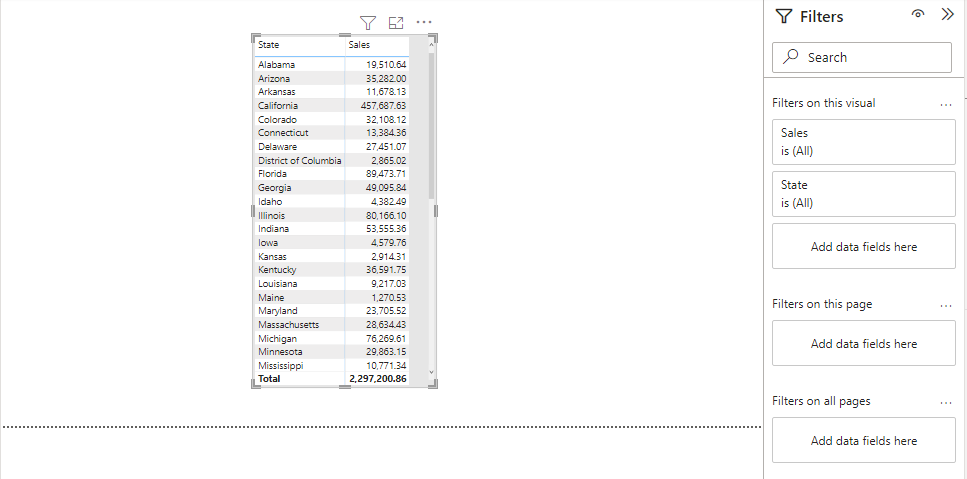
On the Filters pane, you will notice there are two values on the Filters on the visual which are Sales and State. Since I will be filtering by states, I will click on State, and select Filter by N under Filter type.
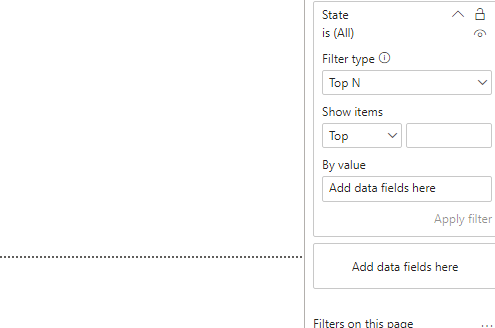
In Show items, make sure it is on Top (because you are working with the top N value). Now, type the number of “N” values you want to work with in the box. Don’t forget the “N” value I am working with is 10 for this tutorial.
After typing the number of “N” values, the next thing to do is to drag the value you want to filter it with.
Since I am looking for the sales value of the top 10 states, I will drag Sales into By value and click on Apply filter.
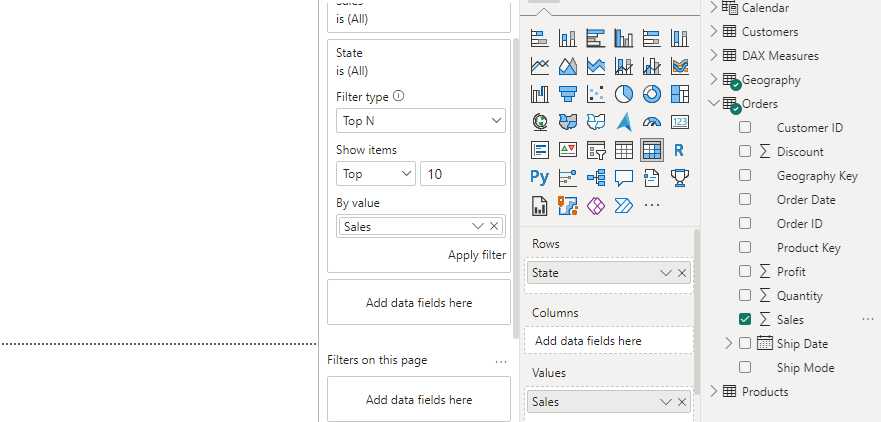
Automatically, this process will change the table on the canvas to display the top 10 sales by States.
Conclusion: How to Get the Top N Items in a Power BI Matrix Table
Keep in mind that these steps will only affect the display of the matrix table or any other form of visualization you are working with, and will not modify the underlying data in any way.
However, if you want to filter the data itself, you will need to use a different method, such as creating a DAX measure or using a slicer.
I hope you understand these steps.
Thanks for reading!