
Power BI is a powerful tool for data analysis and visualization that allows users to create interactive reports and dashboards. One of its key features is the ability to filter data, and even more, allows users to create custom page filters to meet specific needs.
However, it can be difficult to get the most out of this feature without understanding how to create custom page filters in Power BI.
In this article, I will walk you through the steps to create custom page filters in Power BI and apply them to help you better visualize your data.
Let’s get started.
What is a Custom Page Filter?
A custom page filter is an additional filtering option that enables users to create filters on a single page of their Power BI dashboard.
This filter offers further control over the data shown on the page and allows for greater granularity than other filters, such as slicers or visuals.
You can create custom page filters with multiple conditions which help analyze larger datasets or when you need to add specific filters to your reports.
Get Familiar with the Power BI Interface
Before creating custom page filters, you must be familiar with and understand the Power BI interface. Pay close attention to the different elements of the dashboard, such as visuals, slicers, and filters, and take some time to explore how Power BI really works.
A very good understanding of the interface will make it easier for you to create custom page filters and navigate your dashboard with ease.
How to Set up Data Connections and Create Your Visuals
To get started, you need to establish a data connection and create your visuals. To do that, start by setting up your data connections using the get data, direct query, or live connection feature in Power BI.
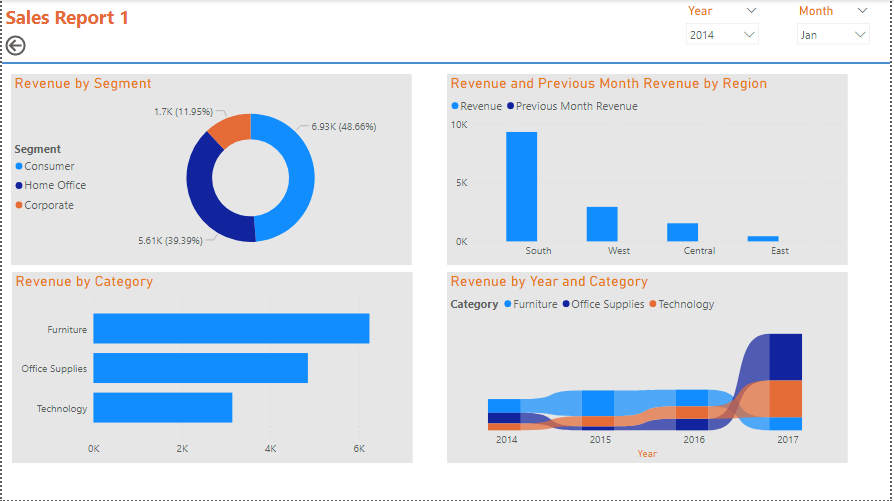
Once the connections are set, select the required table(s) from each of these connections, and create your visuals as needed.
(Here is what mine looks like)
Creating a Custom Page Filter for Your Visuals
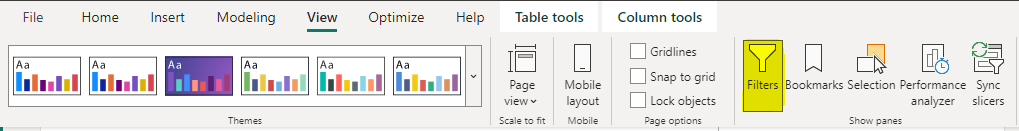
Now that both your data connections and visuals are ready, you can create a custom filter for the page. To do that, make sure you have the Filters pane on or selected on the View tab.
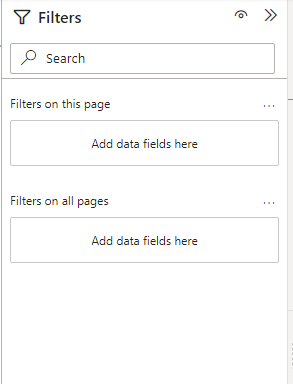
Now, to create a custom page filter for the visuals, go to the Filters pane, and drag the columns you want to filter (in your visuals) into the Filters on this page section.
For example, I dragged the column Region into the filter.
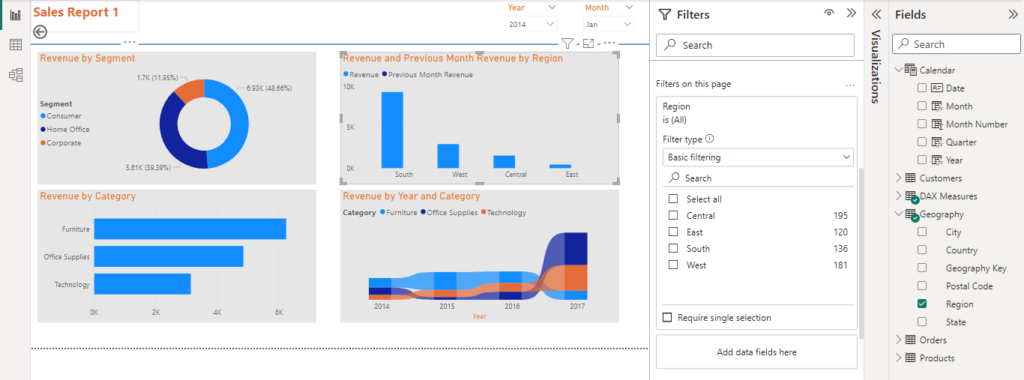
Now, I will click on any of the regions to filter, and it will reflect on the visuals.
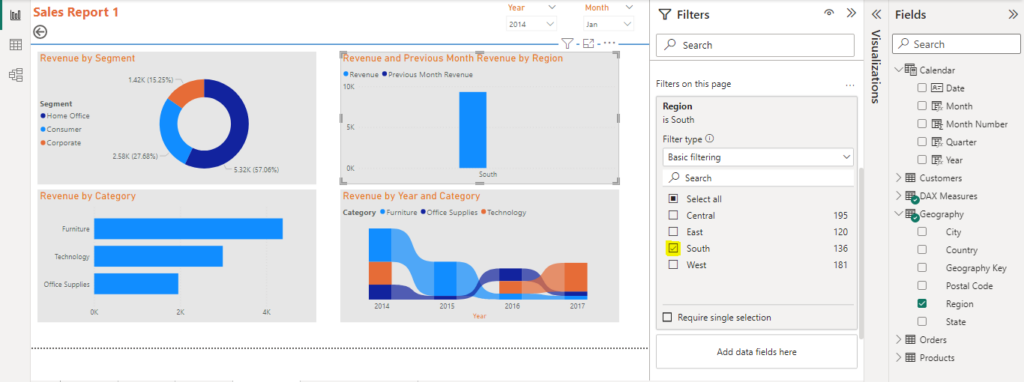
In the above screenshot, can you see a change in the visuals when I selected the South region? Yes, the custom page filter is working!
Now, do this for the columns you want to filter and you will see all your visuals filtered based on the ones you choose.
Adding Calculated Values to Your Filter Selections
In addition to static value selections, you can use DAX formulas to add values to your page filters. By this, you can easily analyze data points range like daily or monthly averages for long-term trend analysis.
Simply go to the “Modeling” tab and select either a “new measure” or a “new column” then enter your formula in the formula bar using different available functions.
4 Mistakes to Avoid When Creating Power BI Custom Page Filters
While custom page filters can significantly improve your data analysis process, here are 4 mistakes you should avoid:
1. Inconsistent filters: Always ensure to be consistent with your filters across different visuals or pages when sharing your analysis to avoid confusion or data misinterpretation.
2. Over-filtering: Do not over-filter your visuals or pages. Always maintain a balance between filtering out irrelevant data and over-filtering to avoid data bias or incomplete analysis.
3. Ignoring default filters: Based on your data model, Power BI provides default filters. Hence, while building custom page filters, consider using these default filters where applicable.
4. Not validating the filtered data: Finally, you must validate your custom page filter to ensure its accuracy and reliability. You can test them in your analysis to verify producing the desired outcomes.
Resources for Further Learning on Custom Page Filters in Power BI
Building custom page filters is just one of many skills to learn in Power BI. To further improve your Power BI skills and expertise, here are some recommended resources:
1. Power BI documentation: This is the official Power BI guide that thoroughly explains different Power BI concepts, including custom page filters, and covers everything from basic concepts to advanced procedures.
2. Power BI community: The Power BI community is also a good resource for learning. It is a community of vibrant Power BI users who connect, share, and learn from each other through questions, advice, and sometimes, inspiration.
3. Power BI user groups and events: Finally, you can also join local Power BI user groups or events around you. With events like feature presentations, workshops, and discussions, you can network, and have access to industry experts who can help you.
4. Online tutorials and courses: Numerous online platforms offer Power BI tutorials and courses you can explore on Power BI custom page filters. They provide practical exercises and expert guidance that can help you master the art.
FAQs: How to Create Custom Page Filters in Power BI
Which are the types of filters in Power BI?
In Power BI, we have three types of filters: report, page, and visual filters.
Can you apply multiple custom page filters to a single page in Power BI?
Yes, you can apply multiple custom page filters to a single page in Power BI. Simply add additional filters using the same process as for creating the first filter.
What is the difference between custom page filters and report-level filters?
Custom page filters are specific to a particular page within a report, while report-level filters apply to the entire report.
Conclusion
Custom page filters in Power BI provide a powerful tool for focusing on specific aspects of data within a report, which can help users limit displayed data and analyze it more effectively.
By following this article, you can easily create custom page filters through a straightforward process, which can be done in just a few steps.
I hope you enjoyed reading this article. You can also read how to set the default page of a Power BI report.
Thanks for reading!