
Power BI is a powerful data visualization tool that allows you to connect to multiple data sources, build relationships between them, create insightful reports, and calculate over multiple tables.
When working with complex data models, it is common to need to perform calculations over multiple tables. This can be a challenge if you are not familiar with the process of creating relationships and measures that reference columns from different tables.
In this article, I will explore how to calculate over multiple tables in Power BI to help you create more accurate and insightful reports.
Read to learn more.
Getting started
The following are the detailed steps to calculate over multiple tables in Power BI:
Import the Data
The first step is to import the data into Power BI. You can do this can be done by clicking on the Get Data button in the Home tab and selecting the data source.
Power BI supports various data sources, such as Excel, SQL Server, Oracle, and other databases.
Create Relationships Between Tables
Once you import the data, it is important to create relationships between the tables that contain the data.
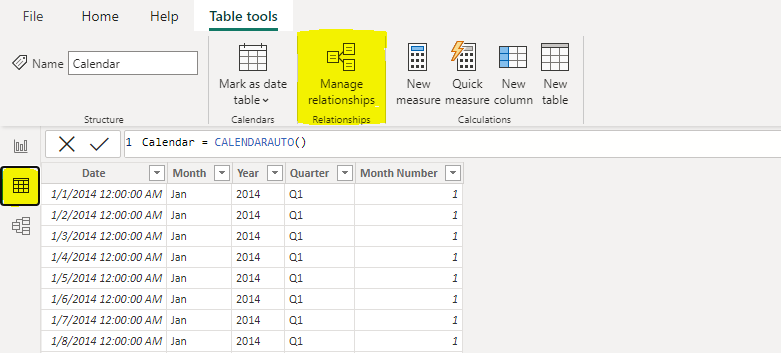
To do this, click Data, select the Manage Relationships button, and create a relationship between the tables you want to calculate.
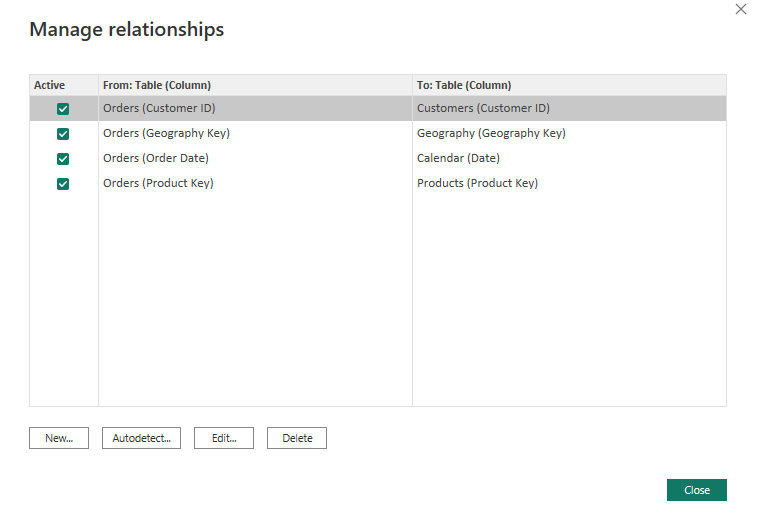
Relationships are created based on the common fields between the tables. Below is the relationship I created between my tables.
Create measures
Once the tables are related, now you can create measures to perform calculations across them.
To create a measure, select the New measure button in the Modeling tab and write a formula that references columns from the related tables.
For example, suppose you have two tables named Sales and Products. Where the Sales table has the following columns: Sale ID, Product ID, Quantity, Price, and Date. While the Products table has the following columns: Product ID and Product Name.
You can enter the following formula to create a measure that calculates the total sales for each product:
Total Sales = SUMX(Sales, Sales[Quantity] * Sales[Price])Then click OK to create the measure.
Use the measures in visualizations
After creating measures, you can use them in visualizations, such as tables, charts, and graphs.
To use a measure in a visualization, drag and drop it onto the visualization canvas. The measure will calculate based on the context of the visualization.
Test and refine the measures
Just like with any calculation, it is important to test and refine your measures to ensure that they are accurate and provide the insights you need.
You can use the Test feature in Power BI to compare the values returned by your measure to expected values based on your data.
Continue to iterate
Finally, it is essential to remember that creating measures to calculate over multiple tables is an iterative process. So, you may need to refine your measures or add new ones as you discover new insights from your data.
Hence, it is good to regularly review and update your calculations to help ensure that your reports remain accurate and relevant.
Conclusion
Calculating over multiple tables in Power BI is a powerful technique that can help you gain deeper insights into your data.
First is by establishing relationships between tables, creating the measures, and visualizing the results in order to build more accurate and insightful reports.
This can help you unlock new insights and drive better decision-making.
I hope you enjoyed reading this article.
Thanks for reading!