In Power BI, you can calculate the difference from the previous months using DAX (Data Analysis Expressions) formulas.
The process involves creating three measures: the first two measures will calculate the values for the current and previous months. Then the third measure will calculate the difference between the first two measures.
In this article, I will walk you through a step-by-step guide on how you can calculate the difference from the previous month in Power BI.
Let’s get started.
Import your Data into Power BI
The first step is to import your data into Power BI, which supports a wide range of sources, such as Excel, SQL Server, and cloud-based sources like Azure, Google Analytics, etc.
To import your data into Power BI, start by launching Power BI Desktop. From the Home tab, click on the “Get Data” button. Choose your preferred data source, and follow the prompts to connect to your data source.
Create a Date Table
A date table contains a list of dates and columns related to the dates. Thus, to perform time-based calculations, you must create a date table, which must include all dates for the time period of your analysis.
To create a date table, using DAX, go to the Modeling tab, then click New Table. Then enter the formula in the dialog box. For example, this formula will generate a table of all dates between the specified start and end date — January 1, 2000 – December 31, 2025.
DateTable = CALENDAR(DATE(2000,1,1), DATE(2025,12,31))Create a Relationship Between the Date Table and Other Tables
After creating the date table, you need to create a relationship between the date table and other tables in your data model — the “Sales” table, in this example.
To create a relationship, go to the “Modeling” tab and click on “Manage Relationships.” In the “Manage relationships” dialog box, click on “New” to create a new relationship.
In the “Create relationships” dialog box, there are two drop-down menus — “Table” and “Column.”
Select the date column from your date table in the first drop-down menu.
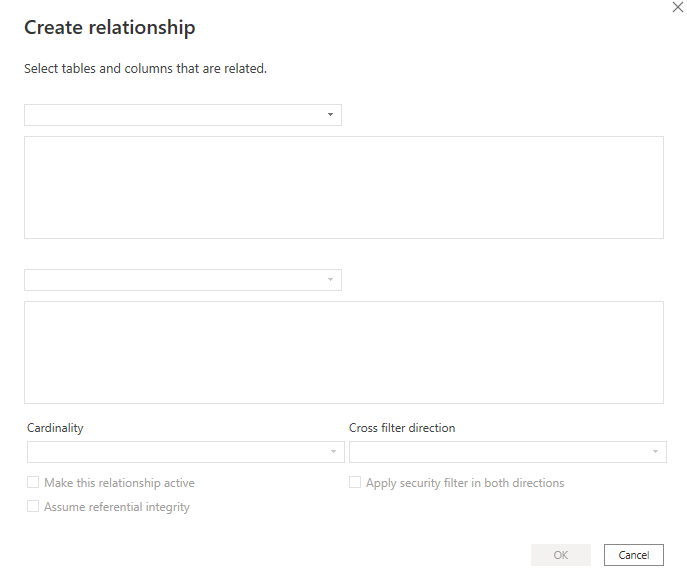
Then in the second drop-down menu, select the related date column from your “Sales” table, and click “OK” to create the relationship.
Create a Measure for the Current Month
After creating a date table, the next thing to do is to calculate the value for the current month.
To do this, create a new measure that will sum up the values for the current month — go to the Modeling tab, and select New Measure.
In the dialog box, enter the formula:
CurrentMonthValue = CALCULATE(SUM(Sales[Amount]), DATESBETWEEN(DateTable[Date], STARTOFMONTH(MAX(DateTable[Date])), ENDOFMONTH(MAX(DateTable[Date]))))In this formula, the CALCULATE function filters the sales amount based on the current month.
The DATESBETWEEN function determines the filter of the date range, which starts on the first day of the current month (via STARTOFMONTH) and ends on the last day of the current month (via ENDOFMONTH).
Finally, the SUM function then sums the sales amounts within that date range, which gives the figure for the current month.
Create a Measure for the Previous Month
The next thing is to calculate the value for the previous month. To do this, you will create a measure that sums up the values for the previous month.
For example, you can create a new measure named PreviousMonthValue in the Modeling tab with the formula below to calculate the value for the previous month:
PreviousMonthValue = CALCULATE(SUM(Sales[Amount]), PREVIOUSMONTH(DateTable[Date]))In this formula, the PREVIOUSMONTH function calculates the previous month based on the Date column of the DateTable. The CALCULATE function then sums up the Sales[Amount] column for the previous month.
Create a Measure for the Difference
Finally, you will create a measure that calculates the difference between the current month and the previous month.
The formula for this measure is:
Difference = [CurrentMonthValue] - [PreviousMonthValue]Visualize the Data in a Chart or Table
Once you create these measures, you can then use them in a table or chart to display the difference from the previous month.
For example, you can create a Power BI Matrix table that shows the current month’s value. Then the previous month’s value, and the difference between the two measures.
This will help you to better understand the trends and patterns in your data, and make it easier to communicate your findings to others.
Choose the visuals that best suit your needs, and modify them to portray the most important insights from your data. Now, you can easily identify trends, patterns, and outliers in your data, and make informed decisions based on your findings.
Fixing Common Issues While Calculating Differences in Power BI
Even if you use the best methods, there may still be problems with your figures. Here are some of the common issues and how to fix them:
- Error messages: If you keep getting error messages when you create your formulas, double-check the formula is correct. You can also look for solutions online.
- Missing data: If you are missing data for a specific date or time period, check again to make sure your data model is set correctly. You might need to modify your formulas or add extra tables or columns to your data model.
- Incorrect calculations: If your calculations do not appear to be functioning properly, double-check your formulas and ensure that you are using the appropriate columns and functions.
FAQs
Is it possible to apply this calculation to a rolling period?
Yes, you can apply this calculation to a rolling period.
Simply modify the formula to use the right time period, such as 3 months or 12 months, instead of the previous month.
Can you use this calculation to compare data from different categories or products?
Yes, you can use this calculation to compare data from different categories or products.
Just replace the [CurrentMonthValue] measure with the measure that calculates the value you want to compare.
Can you calculate the percentage difference from the previous month?
Yes, you can calculate the percentage difference from the previous month.
To do that, you will divide the difference from the previous month by the value for the previous month and then multiply by 100.
Conclusion
That’s it!
You just learned how to calculate differences from previous months in Power BI.
This proves to be a valuable tool for analyzing trends and identifying changes in data over time. Hence, you can easily display the growth or decline in your data.
If you enjoyed reading this article, you can also read how to create a running balance calculation in Power BI.
Thanks for reading!