In Power BI, help tooltips are a stylish way of providing reports with additional and detailed information or context for visualizations.
These tooltips provide additional context, ensuring that users understand the data and its purpose within the report, which you can customize both in Power BI Desktop and the Power BI service.
In this article, I will explain a step-by-step process on how to add help tooltips to your reports in Power BI Desktop, allowing users to access relevant information at any time.
Let’s get started.
What are Help Tooltips?
Help tooltips are small, contextual pieces of details that appear when a user hovers over a specific component in your report.
They can include anything from a brief description of the data to a detailed explanation of how to best use a certain feature. Without overcrowding your report, help tooltips are a terrific way to provide your users with more context and information.
Typically, help tooltips can be helpful for users who are new or barely familiar with Power BI. or the data being presented. Hence, when adding them to your reports, it is important to understand their purpose and how they can enhance the user experience.
How to Create a Tooltip Page in Power BI
Power BI offers different techniques to add tooltips to your reports, each with its benefits and applications. In this section, let’s take a look at two methods you can use Power BI to make tooltips, so you can choose the one that works best for you.
Method 1: The Tooltip Option in Visualizations
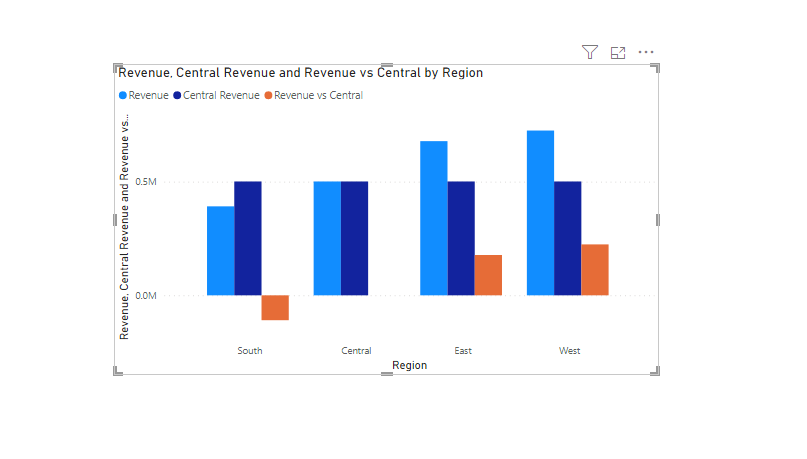
To start with, open your Power BI Desktop and add your visual to the canvas. Make sure to select the visual to which you want to add a tooltip.
(Here is what my visual look like)
Now, to add help tooltips to your visual, go to the “Data” pane and drag the column you want to add into the “Tooltips” data fields in “Visualizations”
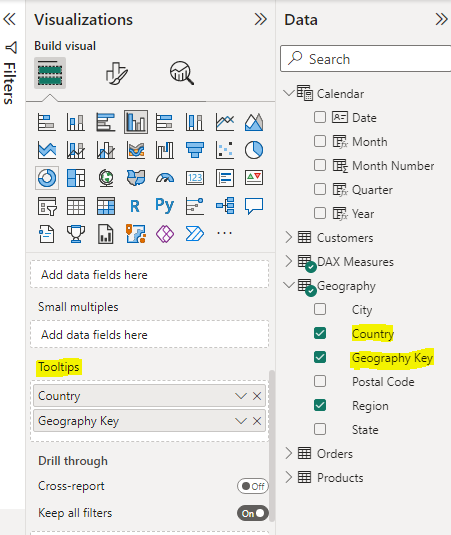
In this example, I dragged “Country” and “Geography Key” into the “Tooltips field. This adds more information to the visual whenever I hover my mouse over it.
NB: This method is very simple, but a bit limited.
Method 2: Creating a Report Tooltip Page
To use this method, start by opening your Power BI report. After that, navigate to the “Data” pane then click + sign to create a blank new tooltip page. Your tooltips will be contained on this page, and you can name this page “Tooltip” or something similar.
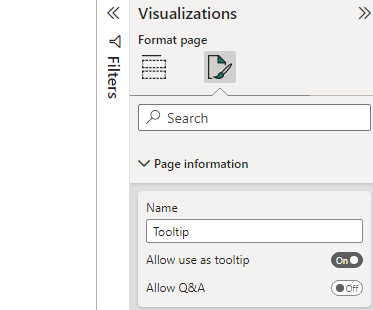
Next is to go to the “Visualization” pane and click on “Format.” Under “Page information” click on the “Tooltip” toggle and make sure it’s “On.”
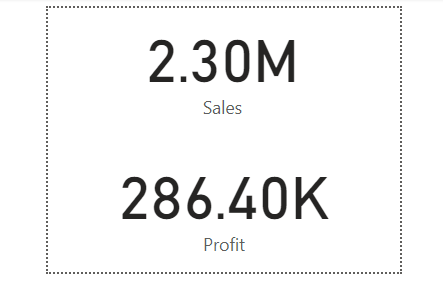
Now, go to the “Data” pane and drag the columns you want to display on your visual to the canvas, and customize them using any visually appealing visualization.
(Here is my customized tooltip page where I used the “Card” visual and the “Sales” and “Profit” columns)
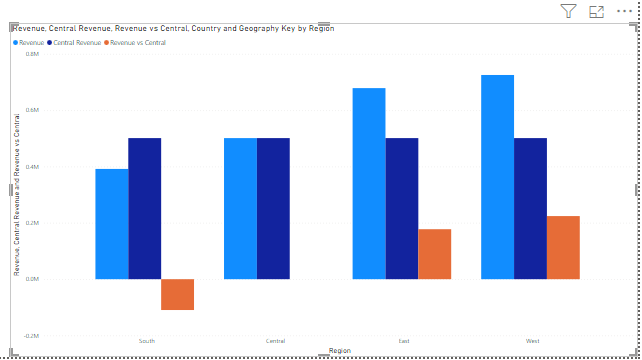
Now, once you create the tooltip page, the next step is to add this tooltip to your visual. To do this, go back to your visualization and select the visual you want to add this newly customized help tooltip to.
(Here is the visualization I want to add the customized help tooltip to)
To add the tooltip, go to the format section in the “Visualization” pane. Here, go to “General,” and click on “Tooltips” then change “Type” to Report page and “Page” to Tooltip (the name of your custom tooltip page).
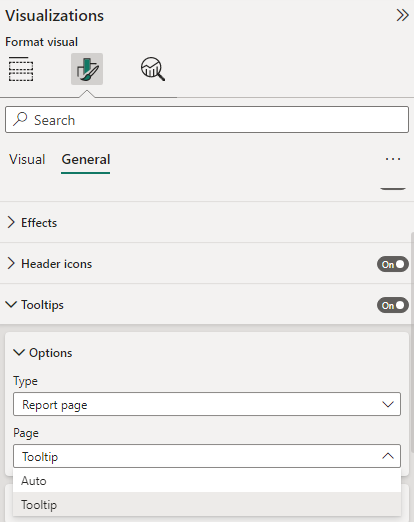
Now, go to the canvas and hover your mouse on your visualization, and it will display the newly customized tooltips you just created.
Benefits of using Help Tooltips in Power BI Reports
There are a lot of benefits to using help tooltips in Power BI reports. One such is to help improve the general user experience, by proving additional context and details, making it easier for them to understand the data.
Another benefit of using help tooltips is reducing support requests, by providing clear and enough information about the data. This can save you some time and resources.
Finally, the use of help tooltips can lead to quicker informed decision-making and better outcomes.
Best Practices for Creating Effective Help Tooltips in Power BI Reports
Now that you understand how to add help tooltips to your Power BI reports, it is essential to know some best practices for creating effective tooltips. The following are a few tips to keep in mind:
- Keep your tooltips short and straight to the point. Users are likely to read and connect with brief and concise tooltips
- Use simple language. Your tooltips should be very easy to understand for users of all levels
- Be consistent in your formatting style. Your tooltips should have a uniform look and feel in all your report
- Finally, always test your tooltips to ensure their effectiveness and functionality.
Common Mistakes to Avoid When Using Help Tooltips in Power BI Reports
While help tooltips can aid your reports, there are a few common mistakes you must avoid:
- Don’t overload your users with too much information. Keep your tooltips brief and to the point
- Don’t use technical jargon or difficult-to-understand languages
- Don’t forget to test your tooltips with users to make sure that they are effective and useful.
NB: It is important to keep the tooltips concise and relevant to the data being presented when customizing them. Too much information or irrelevant information can be confusing to the viewer.
FAQs
Can you associate tooltips with specific visuals in Power BI reports?
Yes, you can associate tooltips with specific visuals or elements in your Power BI report. This allows you to provide more details or context for your audience.
What role does help tooltips play to enhance report visibility?
Help tooltips can enhance report discoverability by briefly describing the key report details and when optimized for search engines, it can improve its visibility.
Why should you add help tooltips to your Power BI report?
Help tooltips can improve the user experience of your report. Hence, providing users with extra information or context about the report.
Can I add help tooltips to Power BI service?
Yes, you can add help tooltips in Power BI service. To do that, just follow the steps explained in this article.
Conclusion: How to Add Help Tooltips to Reports in Power BI
Adding help tooltips to your Power BI reports is a great way to provide users with additional context and information, without cluttering up your report with unnecessary details.
By following the guidelines provided in this article, and keeping in mind some best practices for creating effective tooltips, you can take your reporting to the next level and provide your users with the insights they need to make informed decisions.
So what are you waiting for? Start adding help tooltips to your Power BI reports today!
If you enjoyed reading this, you can also check why your Power BI report screen is not working and how to fix it.
Thanks for reading!