
Do you want to know how much a measure has risen or fallen over different time periods? In Power BI, calculating the percentage change is a simple way to compare different amounts and determine the relative size of one data number with another.
There are different ways to calculate percentage change in Power BI depending on the data structure and the type of visualizations you are working with.
In this article, I will walk you through how to calculate percentage change in Power BI and visualize changes in visuals.
Read to learn more.
Understanding Percentage Change Calculations in Power BI
Calculating percentage change involves calculating the percentage difference between two values or measures in a given data set. This allows you to see how your data changes over time and spot trends not visible in raw data.
Types of percentage change calculations in Power BI include month-over-month (MoM), year-over-year (YoY), and quarter-over-quarter (QoQ) changes. These calculations can be used to track KPIs, find areas for development, and make data-driven decisions.
To calculate percentage change in Power BI, it is important to understand how it works. To start with, create a column with all of the numbers you want to compare over time.
After that, create a new column and subtract the previous value from the new one to create a column or measure showing growth or decline. Divide this measure by the old value and multiply by 100. This will give you the percentage change between values.
There are different to calculate percentage change in Power BI, depending on the data and the output you desire. Let’s go through them.
Method 1: Using “Percentage Difference” in Quick Measure
One of the easiest ways to calculate percentage change in Power BI is to use the “Percentage difference from” quick measure. To do this, follow these steps:
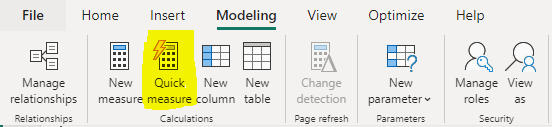
The first thing to do is to select the visualization you want to apply the percentage change calculation to, then go to the Modelling tab, and click on Quick Measure.
In the Quick Measure pane, scroll down to find the Percentage difference, and select it. In the window, select the Base value field and the Value to compare field. Finally, select how to treat blanks in the value to compare. Then click Add to create the measure.
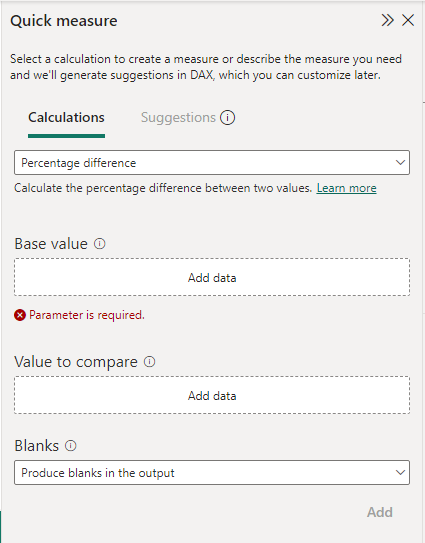
Kindly note that the base value field is the value that you want to compare against, while the value to compare field is the value that you want to measure the percentage change for.
Method 2: Using the DAX Formula
Another way to calculate percentage change in Power BI is to use the DAX formula. This method is more flexible than the Quick Measure method and allows for more suitable customization.
To do this, create a new measure by clicking on the New Measure button in the Modeling tab. Now, to calculate percentage change in Power BI, you can use the DAX formula:
Percentage Change = DIVIDE(SUM(CurrentValue) - SUM(PreviousValue), SUM(PreviousValue)) * 100This formula calculates the difference between the CurrentValue and the PreviousValue and then divides that difference by the PreviousValue. This will result in a percentage change between the two periods.
Replace CurrentValue and PreviousValue with the column or measure names that represent the two periods you want to compare.
Method 3: Using the “YTD” Function
Also, you can use the YTD (Year-To-Date) function to calculate percentage change in Power BI. The YTD function returns the sum of a specified expression from the beginning of the year up to the specified date.
The YTD function can calculate the total value for the current year and the previous year and then use the DIVIDE function to calculate the percentage change between the two.
For example, if you want to calculate the percentage change from the beginning of the year to the current month, you can use the YTD function.
YTD Sales = TOTALYTD(SUM(Sales[Amount]), 'Calendar'[Date])
YTD % Change = DIVIDE([YTD Sales] - CALCULATE([YTD Sales], DATEADD('Calendar'[Date], -12, MONTH)), CALCULATE([YTD Sales], DATEADD('Calendar'[Date], -12, MONTH)))
In this example, I calculated the year-to-date sales using the TOTALYTD function. Then the percentage change from the same month in the previous year using the CALCULATE and DATEADD functions.
Method 4: Using the LASTNONBLANK Function
Finally, you can use the LASTNONBLANK function to calculate percentage change if your data contains gaps or missing values. This function will return the last non-blank value in a column for a specified context.
Assume you have a table called “Sales” with two columns “Month” and “SalesAmount”. You can use the following DAX formula to calculate the percentage change between the current month and the previous non-blank month:
Percentage Change = DIVIDE([SalesAmount] - CALCULATE(LASTNONBLANK(Sales[SalesAmount], Sales[Month] < MIN(Sales[Month]))), CALCULATE(LASTNONBLANK(Sales[SalesAmount], Sales[Month] < MIN(Sales[Month]))))In this formula, the LASTNONBLANK function is used to return the last non-blank value of SalesAmount for the previous month.
The CALCULATE function filters the Sales table to only include months that are less than the minimum month in the current filter context.
The DIVIDE function is then used to calculate the percentage change between the current month’s sales and the previous non-blank month’s sales.
NB: This formula assumes that there are no gaps in the month column and that each month has at least one non-blank value. If there are gaps or missing values, the formula may not return accurate results.
Visualize and Analyze your Results
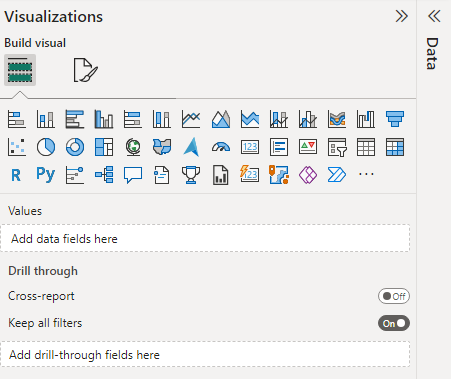
After you have completed your percentage change calculations using any of these methods based on your data, the next step is to create visualizations with it to see and analyze your results.
Power BI offers a wide range of visualizations, such as bar charts and scatter plots, that you can use to represent your percentage change data.
FAQs: Calculating Percentage Change in Power BI
Can you calculate the percentage change for non-numerical data?
No, percentage change is a mathematical calculation that requires numerical data.
However, you can calculate percentage change for numerical data that represents non-numerical categories or groups.
How to format percentage change in Power BI?
You can use the FORMAT function in DAX. For example, you can use this formula to format percentage change with one decimal place:
FORMAT([Percentage Change], "0.0%")Can you calculate percentage change for running totals or cumulative values in Power BI?
Yes, you can use a combination of DAX functions such as CALCULATE, FILTER, and ALL.
Conclusion: Calculating Percentage Change in Power BI
There are several methods to calculate percentage change in Power BI, and while all methods result in the same output, using DAX formulas allows for more flexibility.
However, the method you choose will depend on the type of data you have and the output format you need. For instance, you can add conditions to the DAX formula to only show the percentage change for specific months or years.
By using any of these methods, you can gain valuable insights from your data and make informed decisions for your business or organization.
Thanks for reading.
Happy analyzing!