
In Power BI, you can resize a pie chart due to several reasons such as to make room for additional information, improve readability, emphasize important data, etc., and there are different ways you can do that.
These include adjusting the size of the visual container in the Format pane or using the zoom slider.
In this article, I will explain different ways how you can resize a pie chart in Power BI Desktop to give you the best visualization and as well aid your report.
Introduction: How to Resize Pie Chart in Power BI
By resizing your charts, you can make sure that the text, labels, and data points are large enough to be easily read by the audience.
This can help to ensure that your data is communicated clearly, and effectively. It can as well improve the overall usability and readability of your dashboards and reports.
The following are ways through which you can resize your pie chart in Power BI:
Edit the pie chart visual
The first thing to do is to select the pie chart visual by clicking on it. Once it is selected, you will notice that the visual container has been highlighted. The Format option will appear on the right sidebar in the Visualization pane.
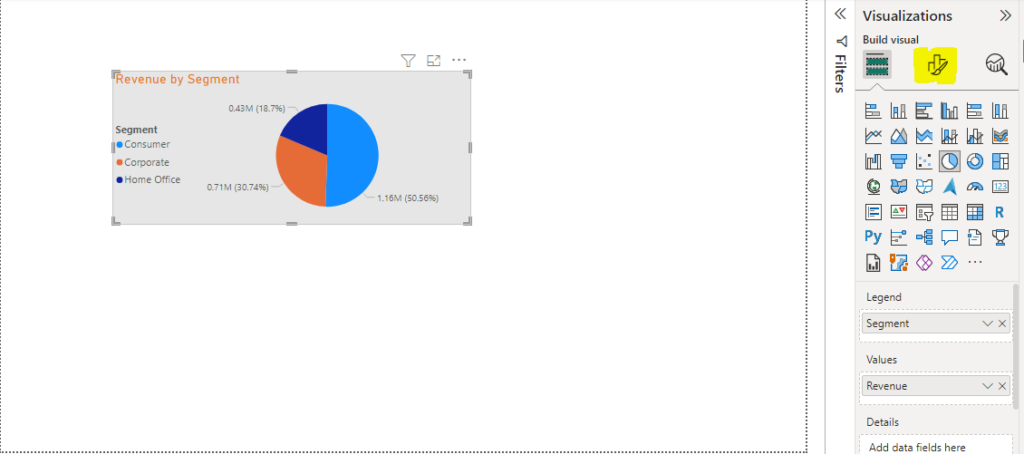
Click on the Format pane
After this, click on the Format option to open the Format pane. Here, you will find different options to resize and customize your chart, including the Size option under General.
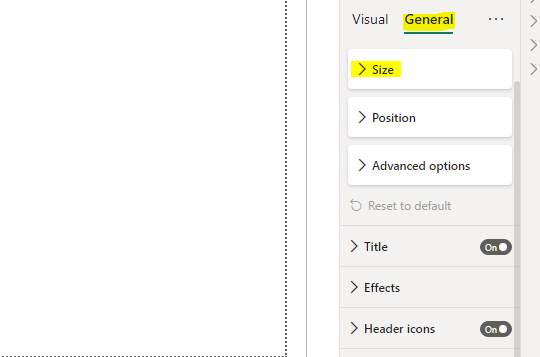
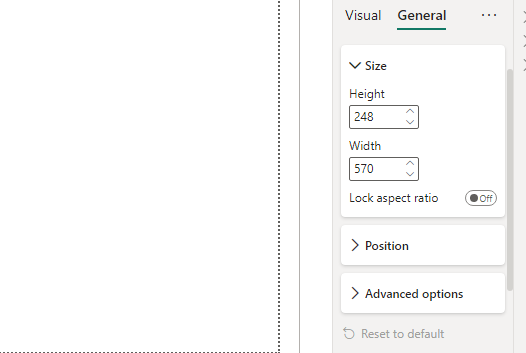
Click on Size to open it up, and you will find two fields: Width and Height. Here, you can enter the desired values in these fields, or use the up and down arrows to adjust the size of the visual container.
Once you are happy with the new size of your chart, you can close the Format pane.
Drag the edges of the chart
As an alternative to the above step, you can also adjust the size of the visual container by dragging the edges of the chart.
When you hover the cursor over the edges of the container, the cursor will change to a double-sided arrow. This indicates that you can now drag the edges to resize the chart.
Use the zoom slider
Also, you can use the Zoom slider, located at the bottom of the screen to resize the pie chart. This slider will zoom in and out of the chart, making it larger or smaller.

Conclusion: How to Resize Pie Chart in Power BI
It is important to note that after resizing the chart, you may need to adjust the font sizes, the position of the legend, and other elements of the chart to maintain readability.
Also, if you are adding this newly-resized chart to a report, you may need to adjust the size of the report page.
I hope you enjoyed these steps.
Thanks for reading!