As a data analyst using Power BI, to count the number of times a value occurs in a column is quite a common task, as it helps uncover valuable trends and patterns in the data.
Furthermore, this is also essential for identifying data irregularities, understanding data distribution, and creating data visuals to facilitate data-driven decision-making.
In this article, I will walk you through how to count the number of times a value appears in a Power BI column using different methods, allowing you to analyze your data more effectively.
So, let’s dive right in!
Create an Overview of the Dataset
To start with, you should get an overview of the dataset you want to work with, as this helps you comprehend the kind of values in the columns, and determine whether there are duplicate values problems.
To create an overview, you can filter your dataset and count the number of rows in each value. You can also do some quick calculations like sums and averages to further understand your dataset.
Insert a Matrix or Table Visual Chart
Now, to begin counting your data, start by inserting a Matrix Table or Table Visual Chart. This chart functions as an interactive spreadsheet and allows you to visualize your dataset.
To insert a chart, go to the “Visualizations” pane on the right side of your Power BI and click on Matrix or Table to insert the visual.
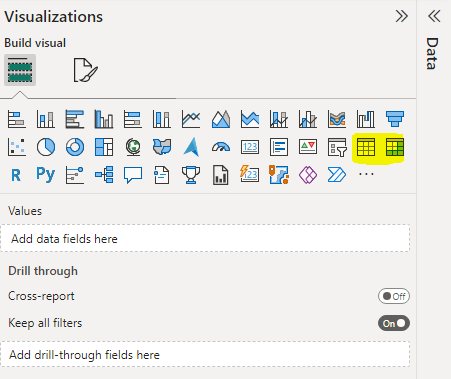
The next thing to do is to drag and drop the columns you want to count into the “Values” and “Fields” sections in the “Data” pane.
How to Count the Number of Times a Value Appears in a Column in Power BI
There are several ways to count the number of times a value appears in a column in Power BI. In this section, I will explore a few of them, from the simplest to the more technical.
Let’s go!
1. Using the COUNT Function
This is the easiest way to count the number of times a value appears in a column in Power BI. The COUNT function estimates the number of rows in a table that contains a specified value or expression.
To use the COUNT function, simply select the column you want to count values in, and then enter the formula in a new column:
Column = COUNT([Column Name])Replace “Column Name” with the name of the column you want to count values in. Then hit the enter button to create a column.
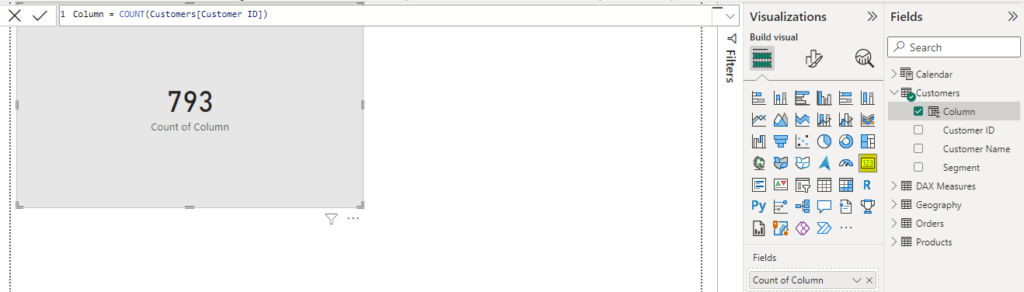
In the example above, I counted the “Customer ID” column and used the “Card” visualization to display the number of times the value appears in the column.
2. Use the GROUPBY Function
The GROUPBY function is another way to count the number of times a value appears in a Power BI column. This function groups data in a column based on specific criteria and then counts the number of rows in each group.
To use the GROUPBY function, select the column you want to count values in, and then enter the formula in the new column:
Column = GROUPBY(Table, Column, "Count", COUNTX(CURRENTGROUP(), [Column]))In your formula, replace “Table” with the name of your table and “Column” with the name of the column you want to group by. Then replace “Count” with the name of the new column you want to create. Then press “Enter” to create the new measure.
3. Use the CALCULATE Function with FILTER
You can also count the number of times a value appears in a column in Power BI using the CALCULATE function with FILTER. You can apply a filter to a column, and then count the number of rows that meet the filter criteria.
To use the CALCULATE function with FILTER, select the column you want to count values in, and then enter the formula in a new column:
Column = CALCULATE(COUNTROWS(Table), FILTER(Table, Column = Value))In your formula, replace “Table” with the name of your table and “Column” with the name of the column you want to filter by, and “Value” with the value you want to count. Finally, press the Enter button to create the new measure.
NB: You can always add these measures to a visual to see the number of times the selected value appears in the selected column.
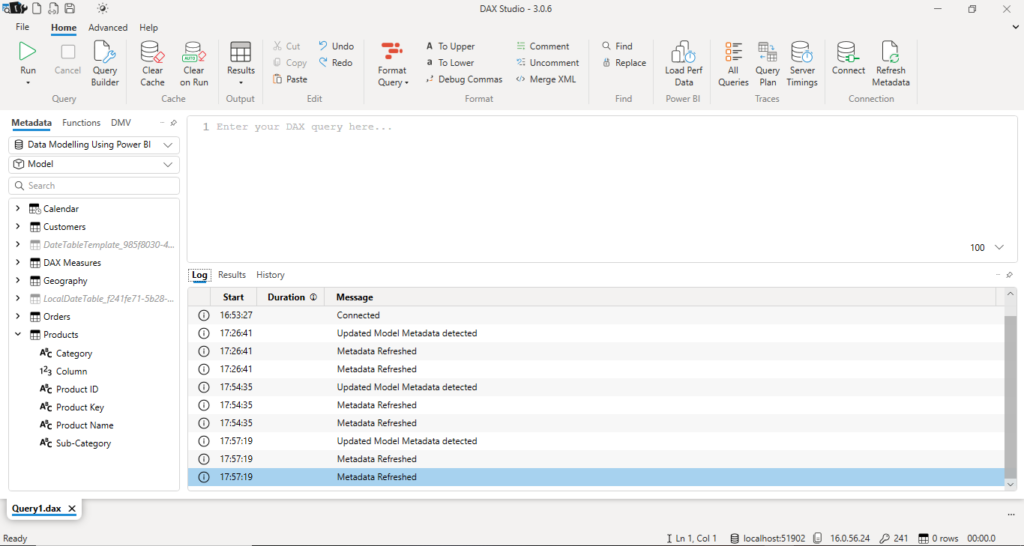
4. Use the DAX Studio to optimize your calculations
The DAX Studio is a great tool for optimising calculations in Power BI. It allows you to write and test DAX formulas, and even to analyze formulas. It can also help to identify bottlenecks, easily count values in a column, etc.
To use the DAX Studio, simply download and install it, and connect it to your Power BI data model. Then you can start writing and testing your formulas, identify any issues, count values in columns, etc.
FAQs
Can you count the number of times a value appears in a column?
Yes, you can count the number of times a value appears in a column using the COUNTX and FILTER functions. Here’s an example DAX formula:
CountValues = COUNTX(FILTER(Table, Table[Column] IN {"Value1", "Value2", "Value3"}), 1)Replace “Table” with the name of your table and “Column” with the name of the column you want to count values in. Also, replace “Value1”, “Value2”, and “Value3” with the specific values you want to count.
How to count the number of unique values in a column in Power BI?
You can use the DISTINCTCOUNT function to count the number of unique values in a column.
For example, to count the number of unique values in a column called Class, you can use the formula: DISTINCTCOUNT('Table'[Class])
Conclusion: How to Count the Number of Times a Value Appears in a Column in Power BI
Counting the number of times a value appears in a column is a common task in Power BI analysis. This helps to gain insights into the number of times a value occurs and can be used for different purposes.
However, depending on the nature of the data and analysis needs, you can choose to use any of the methods explained in this article. With that, you can effectively analyze your data and get valuable insights to support your business findings.
If you enjoyed reading this article, you can also check how to count for the current month in Power BI.
Happy analyzing!