
To calculate the average in a dynamic way in Power BI, you can use the AVERAGEX function. This function allows you to calculate the average of a set of values using an expression that evaluates each row individually.
The AVERAGEX function is useful for calculating dynamic averages in Power BI. Also, it can be helpful to create more flexible and responsive reports that can adapt to changes in the data.
In this article, I will walk you through how to use the AVERAGEX function to calculate the average in a dynamic way in Power BI.
Read to learn more.
Introduction: How to Calculate the Average in a Dynamic Way
Here are the steps to use the AVERAGEX function to calculate the average in a dynamic way in Power BI:
Create visual
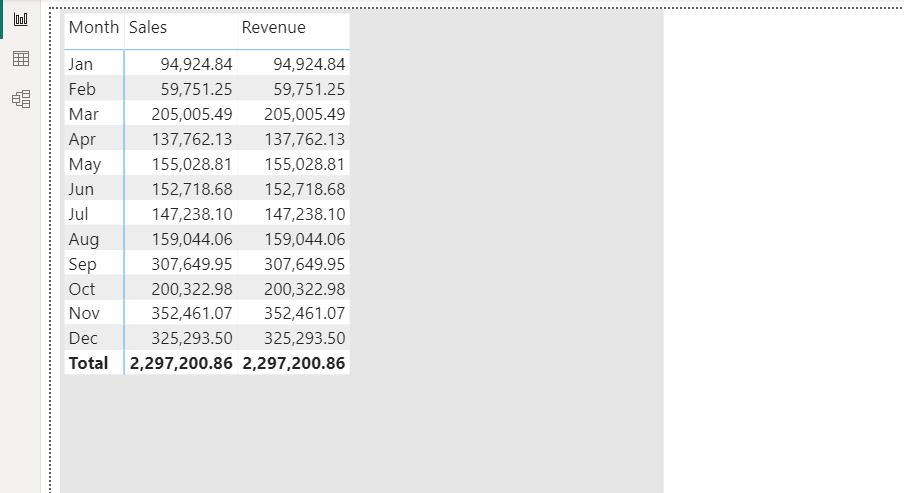
To start with, create a table or matrix visual that displays the data you want to calculate the average for. Then select the field you want to calculate the average for.
Create a measure
After this, create a new measure by clicking on the New Measure button in the Modeling tab. You can give your measure a name, such as Dynamic_Average.
In the formula bar, enter the following formula using the AVERAGEX function:
Dynamic_Average = AVERAGEX(TableName, [expression])For example, if you want to calculate the average of a column named Sales, from the table Orders, the formula would be:
Dynamic_Average = AVERAGEX(Orders, Orders[Sales])
Then press Enter to create the measure.
Add the measure to your visual
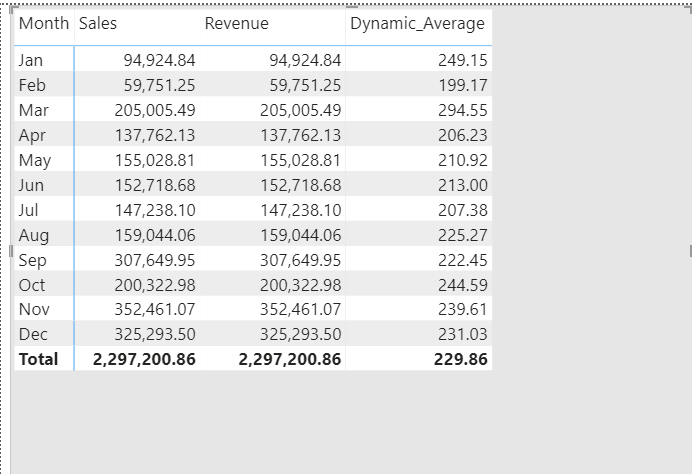
Once you create the measure, you can add it to your visual to display the dynamic average. The average will update automatically based on any filters or slicers applied to the visual.
Now, you can use the Dynamic_Average measure in your visuals and it will calculate the average based on the context of your report.
FAQs
What other function(s) can be used to calculate a dynamic average in Power BI?
You can also use the CALCULATE function to calculate a dynamic average in Power BI.
How does the AVERAGEX function work in Power BI?
The AVERAGEX function in Power BI calculates an average based on an expression that evaluates each row individually.
Can you calculate a dynamic average for a specific time period in Power BI?
Yes, you can.
You can use functions like DATESINPERIOD or SAMEPERIODLASTYEAR in combination with AVERAGEX or CALCULATE to calculate a dynamic average for a specific time period.
Can you use a dynamic average in a Power BI report connected to a live data source?
Yes, you can.
The average will update automatically as new data is added or changes are made to the data.
Conclusion: How to Calculate the Average in a Dynamic Way
By following the steps explained in this article, you can calculate the average in a dynamic way that adjusts based on the data displayed in your visual using the AVERAGEX function. Thus, you can provide more accurate and relevant insights to your audience.
NB: The AVERAGEX function iterates through each row of the table and calculates the average of the expression for each row.
This means that the result can be affected by any filters or slicers that you have earlier applied to your report.
I hope you understood these steps.
Thanks for reading!