Firstly, to calculate rank and max values in Power BI, it is important to understand what rank and max values are.
The rank of a value refers to its position relative to other values in a data set. For example, if you have a column of sales data, the rank of a specific sale would be its position relative to the other sales in the data set.
The max value, on the other hand, refers to the highest value in a data set. The max value returns the highest value in a column it is calculated for.
In this article, I will explain how to calculate rank and max values in Power BI using DAX formulas in Power BI.
Let’s get started.
Calculating Rank Values
To calculate the rank values, you can follow the following steps:
Load your data source
Before you can calculate the rank and maximum values, you need to load your data source into Power BI. This could be a CSV file, a database, or any other data source that Power BI supports.
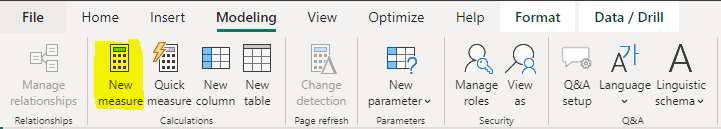
Create a new measure
The next thing to do is to create a new measure. A measure is a calculation that you create based on the data in your data source. To create a new measure, go to the Modeling tab in Power BI Desktop and click on New Measure.
Calculate the rank value
In the dialog box, you can use the RANKX function to calculate the rank value. The syntax for using the RANKX function in Power BI is as follows:
RANKX(table, expression, [value], [order])where:
- “table” is the table containing the column with the values you want to rank
- “expression” is the DAX expression that returns the values to rank
- “[value]” is an optional parameter that specifies the value to rank
- “[order]” is an optional parameter that specifies the sort order, either ascending or descending
For example, if you have a table named Orders with a calculated column named Revenue, and you want to rank the products by revenue in ascending order, you can use the following expression:
Sales_Rank = RANKX(Orders, [Revenue], , ASC)This will calculate the rank of each product based on its revenue, with the highest revenue product having a rank of 1.
NB: The RANKX function can only be used with any data type that can be compared such as numbers, dates, and text. Also note that if multiple values in the column have the same rank, the function will return the same rank value for each of them.
Calculating Max Values
To calculate max values, you can follow the following steps:
Load your data source
Before you can calculate the rank and maximum values, you need to load your data source into Power BI. This could be a CSV file, a database, or any other data source that Power BI supports.
Create a new measure
To calculate the rank and maximum values, you need to create a new measure. A measure is a calculation that you create based on the data in your data source. To create a new measure, go to the “Modeling” tab in Power BI Desktop and click on “New Measure”.
Calculate the max value
In the dialog box, use the MAX function to calculate the max value. The function returns the highest value in a column. The syntax for the MAX function is as follows:
MAX(<expression>)where:
<expression>: refers to the column to find the maximum value of.
For example, if you have a table named Sales with a calculated column named Revenue, you can use the MAX function as follows:
Max Sales = MAX(Sales[Revenue])This will return the highest revenue value in the Revenue column of the Sales table.
Use the measures in visualizations
Once you have created the measures, you can use them in visualizations such as tables, charts, or gauges. To use a measure in a visualization, simply drag it from the “Fields” pane onto the visualization.
Conclusion
Calculating rank and max values in Power BI is a powerful way to gain insights into your data.
By creating new measures and using the RANKX and MAX functions, you can understand the position of a value relative to others and find the highest value in a data set, which can be used in visualizations to provide clear and actionable insights.
With these skills, you can make informed decisions and take action based on the data, helping to drive the success of your organization.
I hope you understood these steps.
Thanks for reading!