In Power BI, you can sort matrix columns by rank measure by using the Sort by option just above the canvas.
Generally, sorting matrix columns is important in cases where you want to compare different categories based on a specific measure.
Hence, by ranking the categories based on the measure, you can easily identify which categories are performing well and the ones that need improvements.
This can be very helpful when dealing with large datasets where it may be difficult to identify trends or outliers. Sorting by rank measure can also be useful for creating visualizations that are more intuitive and easier to understand for viewers.
In this article, I will explain a step-by-step guide on how you can sort matrix columns by rank measure in Power BI.
Let’s get started.
Introduction: How to Sort Matrix Columns by Rank Measure
You can follow the below steps to sort your matrix columns in Power BI:
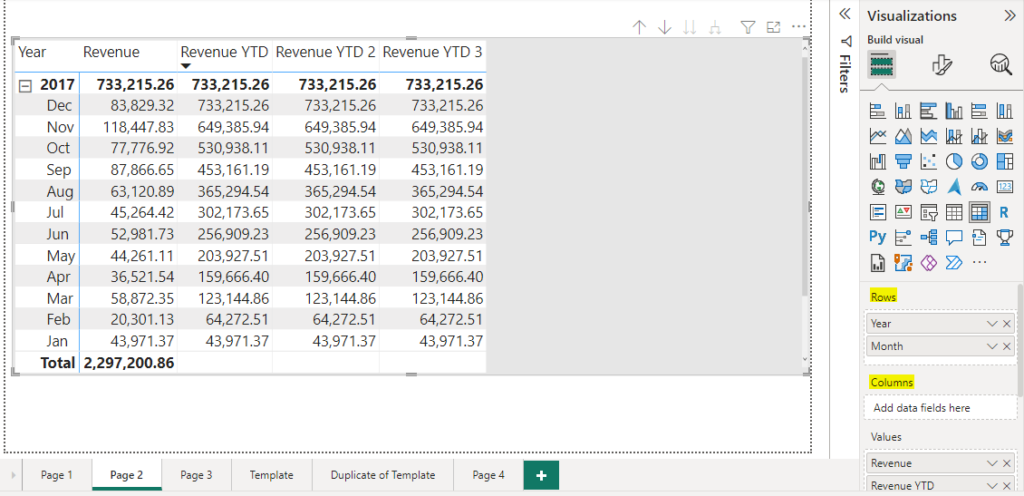
Create a matrix visualization
You can do this by dragging and dropping the desired fields into the Rows and Columns sections of the Visualizations pane. (As displayed below)
Create a measure
The next thing to do is to create a measure that calculates the rank of the column based on a value in that column.
Create a measure that calculates the rank of each column by using the RANKX function. For example, if you have a Revenue column and want to rank the columns based on revenue, you can create a measure using the RANKX() function:
Revenue_Rank = RANKX(ALLSELECTED('Table'[Column]), CALCULATE(SUM('Table'[Revenue])))This formula calculates the rank of each column in the Table table based on the sum of the “Revenue” column.
Make sure to replace ‘Table’ and [Revenue] with the actual names of the table and column in your data model.
Add the measure to the visualization
The next thing to do is to add the measure to the matrix visualization by dragging and dropping it into the Values field.

Sort by column
To sort by column, click on the matrix visualization to select it. Click on the ellipsis button (three dots) just above the canvas and select Sort by. Here, you can sort by the column which you just created a measure for.
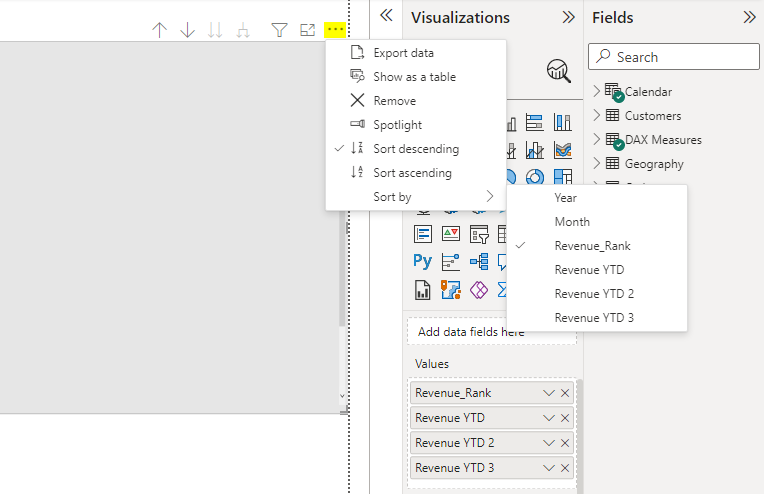
The matrix columns will now be sorted based on the Revenue_Rank measure. You can go further and select the sorting order (ascending or descending).
FAQs: How to Sort Matrix Columns by Rank Measure
What is a matrix in Power BI?
A matrix is a type of visual in Power BI that displays data in rows and columns, similar to a table.
However, matrices allow for more advanced grouping and summarization of data, as well as the ability to display subtotals and totals.
What is a rank measure in Power BI?
A rank measure is a DAX formula that assigns a unique rank or position to each row or item in a table based on a specific measure.
It is useful for analyzing and comparing data based on its relative position, rather than just its absolute value.
How can you troubleshoot issues with sorting by rank measure in Power BI?
To troubleshoot your rank measure issues, you should double-check your DAX formulas to ensure they are correctly calculating the rank measure.
Also, you can test different sorting and ranking options to see what works best for your specific data and use case.
Can you apply conditional formatting to the matrix columns based on the rank measure?
Yes, you can. This allows you to highlight specific columns based on their rank, making the data easier to visualize and analyze.
Conclusion: How to Sort Matrix Columns by Rank Measure
By following these steps, you can sort matrix columns by rank measure in Power BI.
Also, you customize the matrix by adding other measures, changing the formatting, and applying filters.
I hope you understood these steps.
Thanks for reading!