
During data analysis, you can export Power BI charts to Excel for several reasons such as for more detailed analysis, team collaboration, integration with other applications, etc. And there are different methods to do so, depending on your specific needs and the format of the chart.
This article explains an in-depth and step-by-step process of exporting data from Power BI to Excel through different methods.
Read to learn more.
Introduction: How to Export Power BI Charts to Excel
Basically, exporting Power BI charts to Excel means transferring a chart created in Power BI to an Excel workbook.
This chart can be further used for analysis, presentation, or to build other reports. The following are methods to export Power BI charts to Excel:
Method 1: Export from the Visual Itself
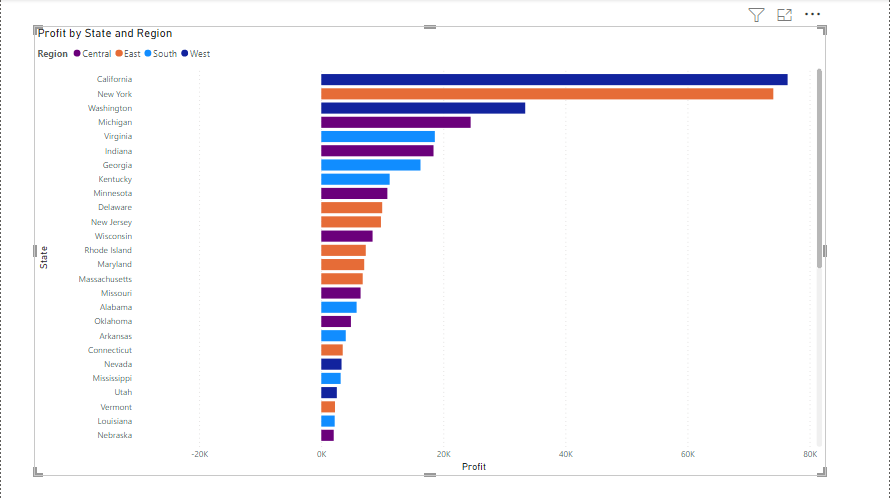
The first method to export Power BI Charts to Excel is to export it from the visual itself. To do that, make sure you have your chart ready on your Power BI Desktop. Then open the Power BI report that contains the chart or graph you want to export.
(Below is the chart I want to export to Excel)
Select the chart or graph that you want to export by clicking on it, and to export data from a visual, click on the “…” button at the top right of the visual, then select Export data.
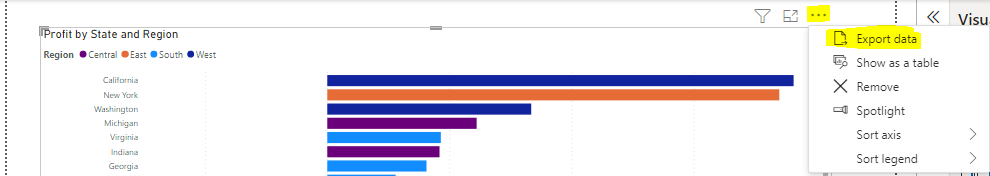
Now, it is up to you to download in your preferred format either as a CSV or XLSX file format that contains the data related to the visual.
NB: This method is very basic and has limitations such as:
- Only being able to export data from one visual at a time.
- Not being able to keep the data in Excel updated as the Power BI report changes.
- Only being able to export data related to a Power BI visual, it is not possible to extract a table, as the data and the model can’t be viewed in the published version.
Method 2: Export From Power BI Service Using the “Analyze in Excel” Function
Alternatively, you can as well export your data using the Analyze in Excel function in Power BI service.
Follow the below steps to do that:
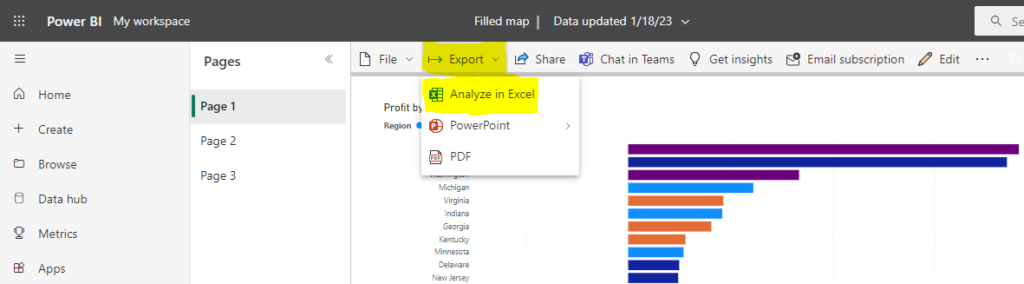
- Open the report that includes the dataset you want to export.
- Click on Export, which is on the ribbon above the report.
- Then select Analyze in Excel from the drop-down menu.
This process automatically downloads the report as an Excel file. Now, you can then use the data to create PivotTables, visuals, etc.
While the “Analyze in Excel” function in Power BI provides effortless exporting of charts and data to Excel, it has a few limitations, such as:
- Loss of interactivity
- Lack of real-time data refresh
- Limited functionality and visualizations
- Increased file size and performance implications
- Potential security and data governance concerns
Method 3: Use the “Get Data” Option on the Excel Data Tab
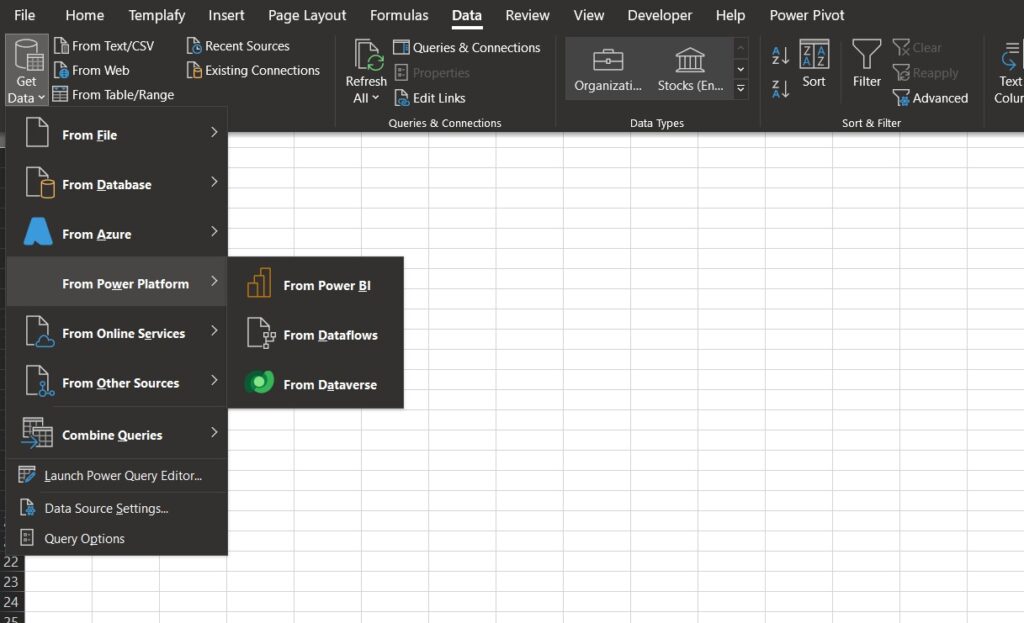
The last method is to use the Get Data option in Excel. To do that, click Get Data on the Excel Data tab and select From Power Platform, and then choose From Power BI.
(See mine below)
From there, you can choose a dataset from the right-hand pane and select fields from the PivotTable Field List to build a Pivot Table.
NB: While this method is a quick way to export charts from Power BI to Excel, it is not the most efficient. This is because selecting fields from the PivotTable Field List can make it hard to understand the data set, especially if you did not create the dashboard.
Avoid These Common Mistakes When Exporting Power BI Charts to Excel
Here are some common mistakes to avoid when exporting Power BI charts to Excel:
- Ensure to select the right chart type before exporting it to Excel
- Make sure to correctly format your charts before exporting them
- Ensure that your data is up-to-date before exporting your chart to Excel
- Avoid exporting complex charts that rely on the interactivity of Power BI
Alternative Tools for Data Analysis
While Power BI and Excel are popular data analysis tools, there are other alternatives such as:
- Tableau — a data visualization tool that lets users build interactive charts and dashboards.
- Google Analytics — a web analytics tool that offers website traffic data and user activity
- SPSS — a statistical analysis software that allows for complex analyses
FAQs: How to Export Power BI Charts to Excel
Can you export a Power BI chart to Excel in a specific size or resolution?
No, you cannot export Power BI charts to Excel in a specific size. The exported chart will be in the same size and resolution as it appears in the report.
Can you export multiple Power BI charts to Excel at once?
No, you cannot export multiple Power BI charts to Excel at once. You can only export each chart individually.
Can you export a chart to a specific sheet in Excel?
Yes, you can. You can choose to export it to a new sheet or an existing sheet in your Excel workbook when you export the chart.
Conclusion
Now, you can see that exporting Power BI charts/graphs to Excel is a very simple process if you followed the above steps outlined in this article.
Now you can take your data analysis to the next level by easily exporting your charts to Excel from Power BI with any of these methods.
If you enjoyed reading this, you can also check how to export lists of app users in Power BI.
Happy analyzing!